Aiming to solve planning issues among high school students once and for all, I created the ultimate school work manager application that lets students get on top of their schedule. It is a union of a calendar, grade tracker, and survey system that lets struggling students see and realize what’s going on.
This project is suggested by Mr. Lewis (my CS teacher) and Mrs. Danger, without whom this project will be impossible.
My Client, Mrs. Dengler, is a teacher at the Learning Center at St. Paul's Schools for Boys. Her job is to manage student that needs help (in academics) by giving them the right resources they need to succeed. Rather than teaching students directly the material they need, she teaches student how to be better learners. Evaluating student progress is crucial for her to adapt the tutoring plans to fit the student’s needs. She not only needs to know if a student is struggling but also where and how a student is struggling.
Currently, the process of evaluating a student’s progress is done by period grade checks and surveys. This, although very inefficient and messy, is the best method on her hand. It often results in a misunderstanding of student progress, which will lead the student to miss the best opportunity to catch up and improve before improvements become difficult or less weighted in their GPA.
The need for a new digital system is obvious: A Student and Mrs. Dengler should receive immediate feedback when their grade needs attention, and they should have better visualization of a student's grade instead of gazing at a list of assignments. Beginning from winter 2019, I started to envision a solution to help her, her students, and potentially countless students around the world.
I believe a dedicated iOS(potentially macOS Catalyst) application is the best and most efficient way to solve Mrs. Dengler’s problem. More extensively, student, even though they certainly can, is not expected to run it on their own devices. Dedicated iPads can be introduced to the learning center for this purpose. As the middle school and the lower school both use iPads in some shape or form, having iPads for the learning center is viable. Additionally, Apple provides a programming language called Swift, which I used extensively. Developing in Swift results in a more efficient working environment for me, the developer, and a better product for my Client. The framework SwiftUI and macOS Catalyst allow efficient yet powerful UI layout capabilities, and cross-platform capabilities to the App. This makes transferring an iOS application to macOS accessible and allows future developments beyond the scope of this IA. I will develop my app with SwiftUI embedded in the UIKit application as the front end, and Google Firebase as the backend. Since Google Firebase Frameworks simplifies signing in, registration, data storage, etc, in a low-level manner, using it will make my app more elegant and powerful. Instead of making the backend myself, the Google Firebase server offers me a scalable and worry-free solution that fits my needs.
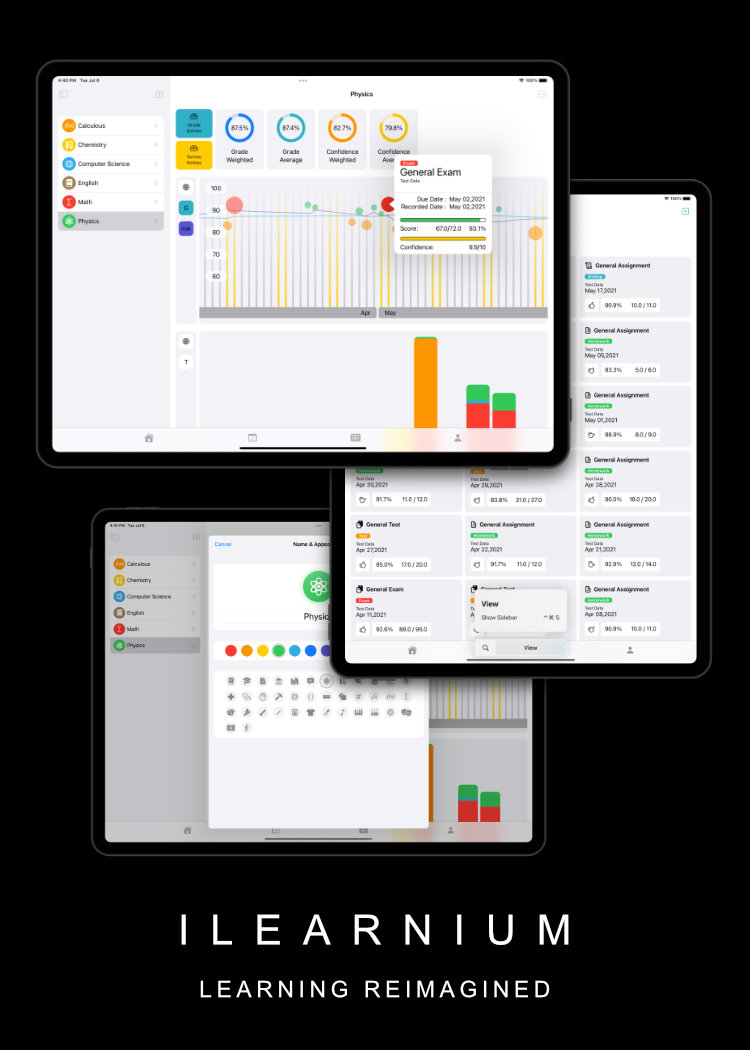
The target user of this application (teenagers) requires that the UI be attractive. The user interface needs to reflect the analytic result and grab the user’s attention. It also needs to display information in the forms of shapes and graphs, which is inherently better at conveying ideas than plain words.
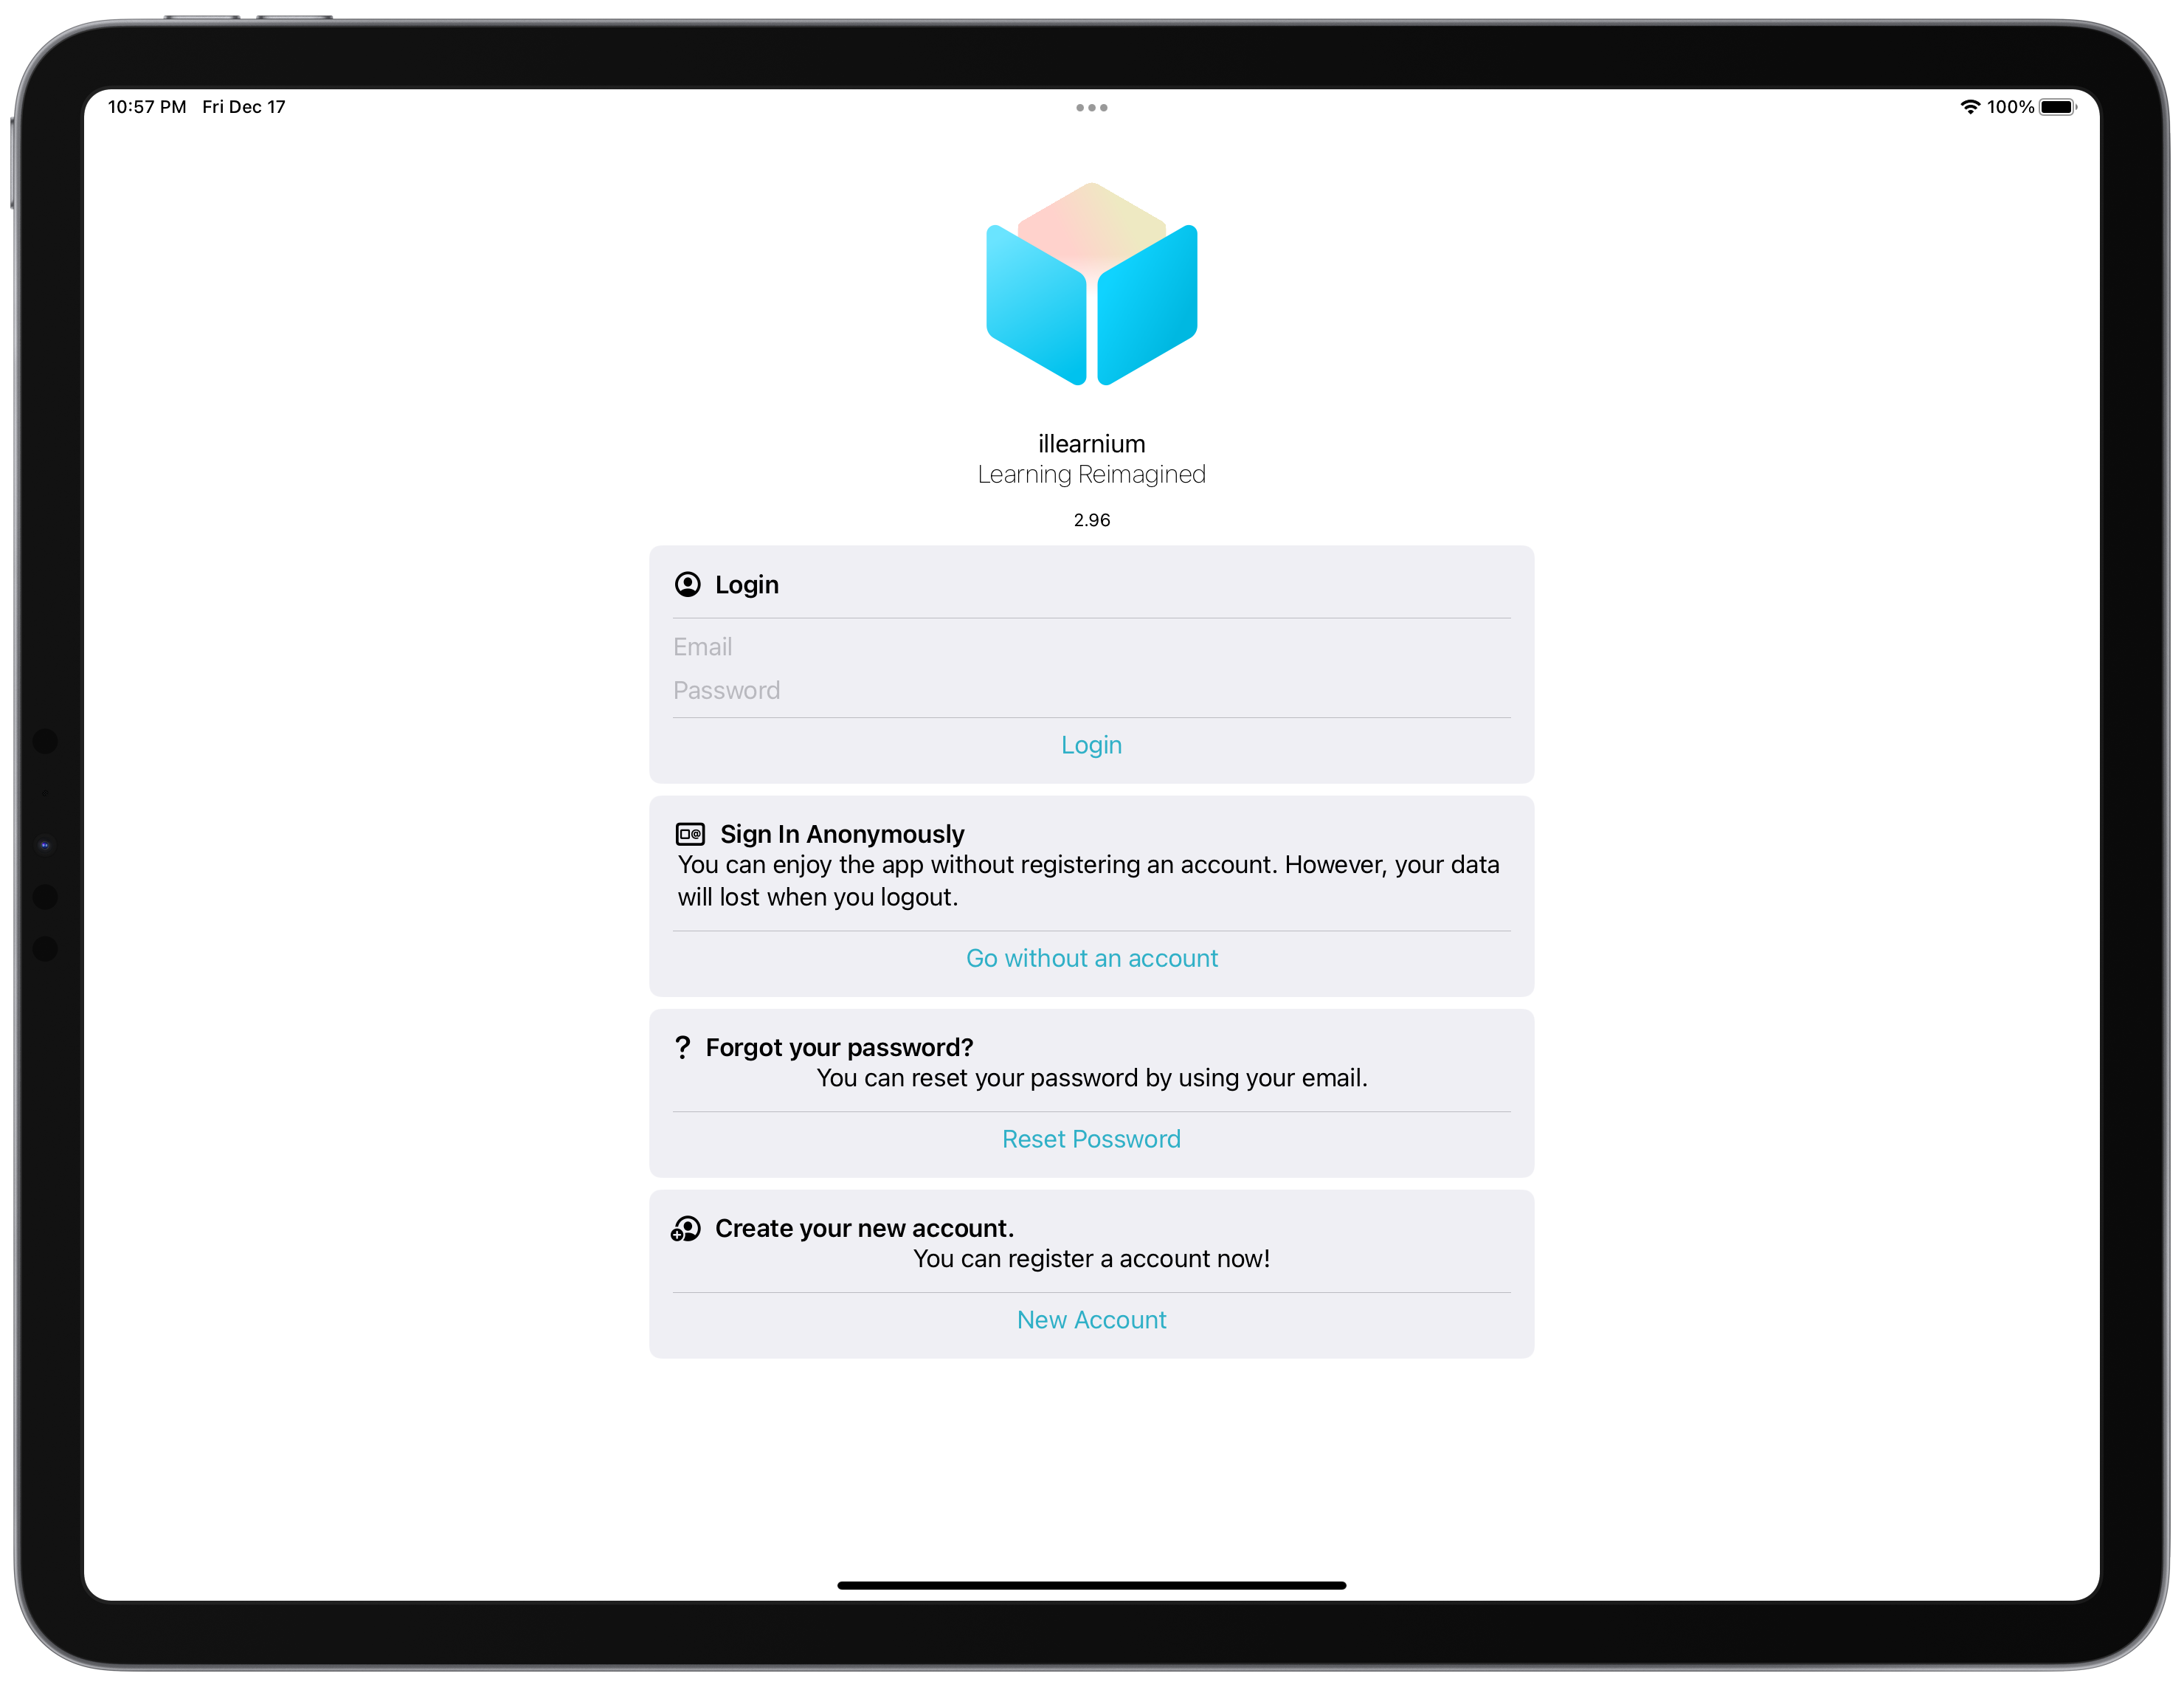
When the user opens the application, they will be prompted to log in to your account. The reason why using cloud storage instead of storing the users' data locally is to ensure the safety of their data. This prevents users' data from being deleted accidentally and ensures that the user’s data can be accessed by different devices running the application.
The user can choose to log in without an account. This enables the user to trial the application without creating an account. After they have decided to utilize the application, they can simply attach their email and create a password to convert their account into a permanent one. Of course the option to sign in with third-party providers like “Sign in with Google” will be available in the future.
Upon signing in, the user will be presented to the home screen. On it, there will be an articles section that (in the future) include study tips, feature showcases, and other types of articles. Below that section, a concise version of their calendar will be displayed, showing the relevant events.
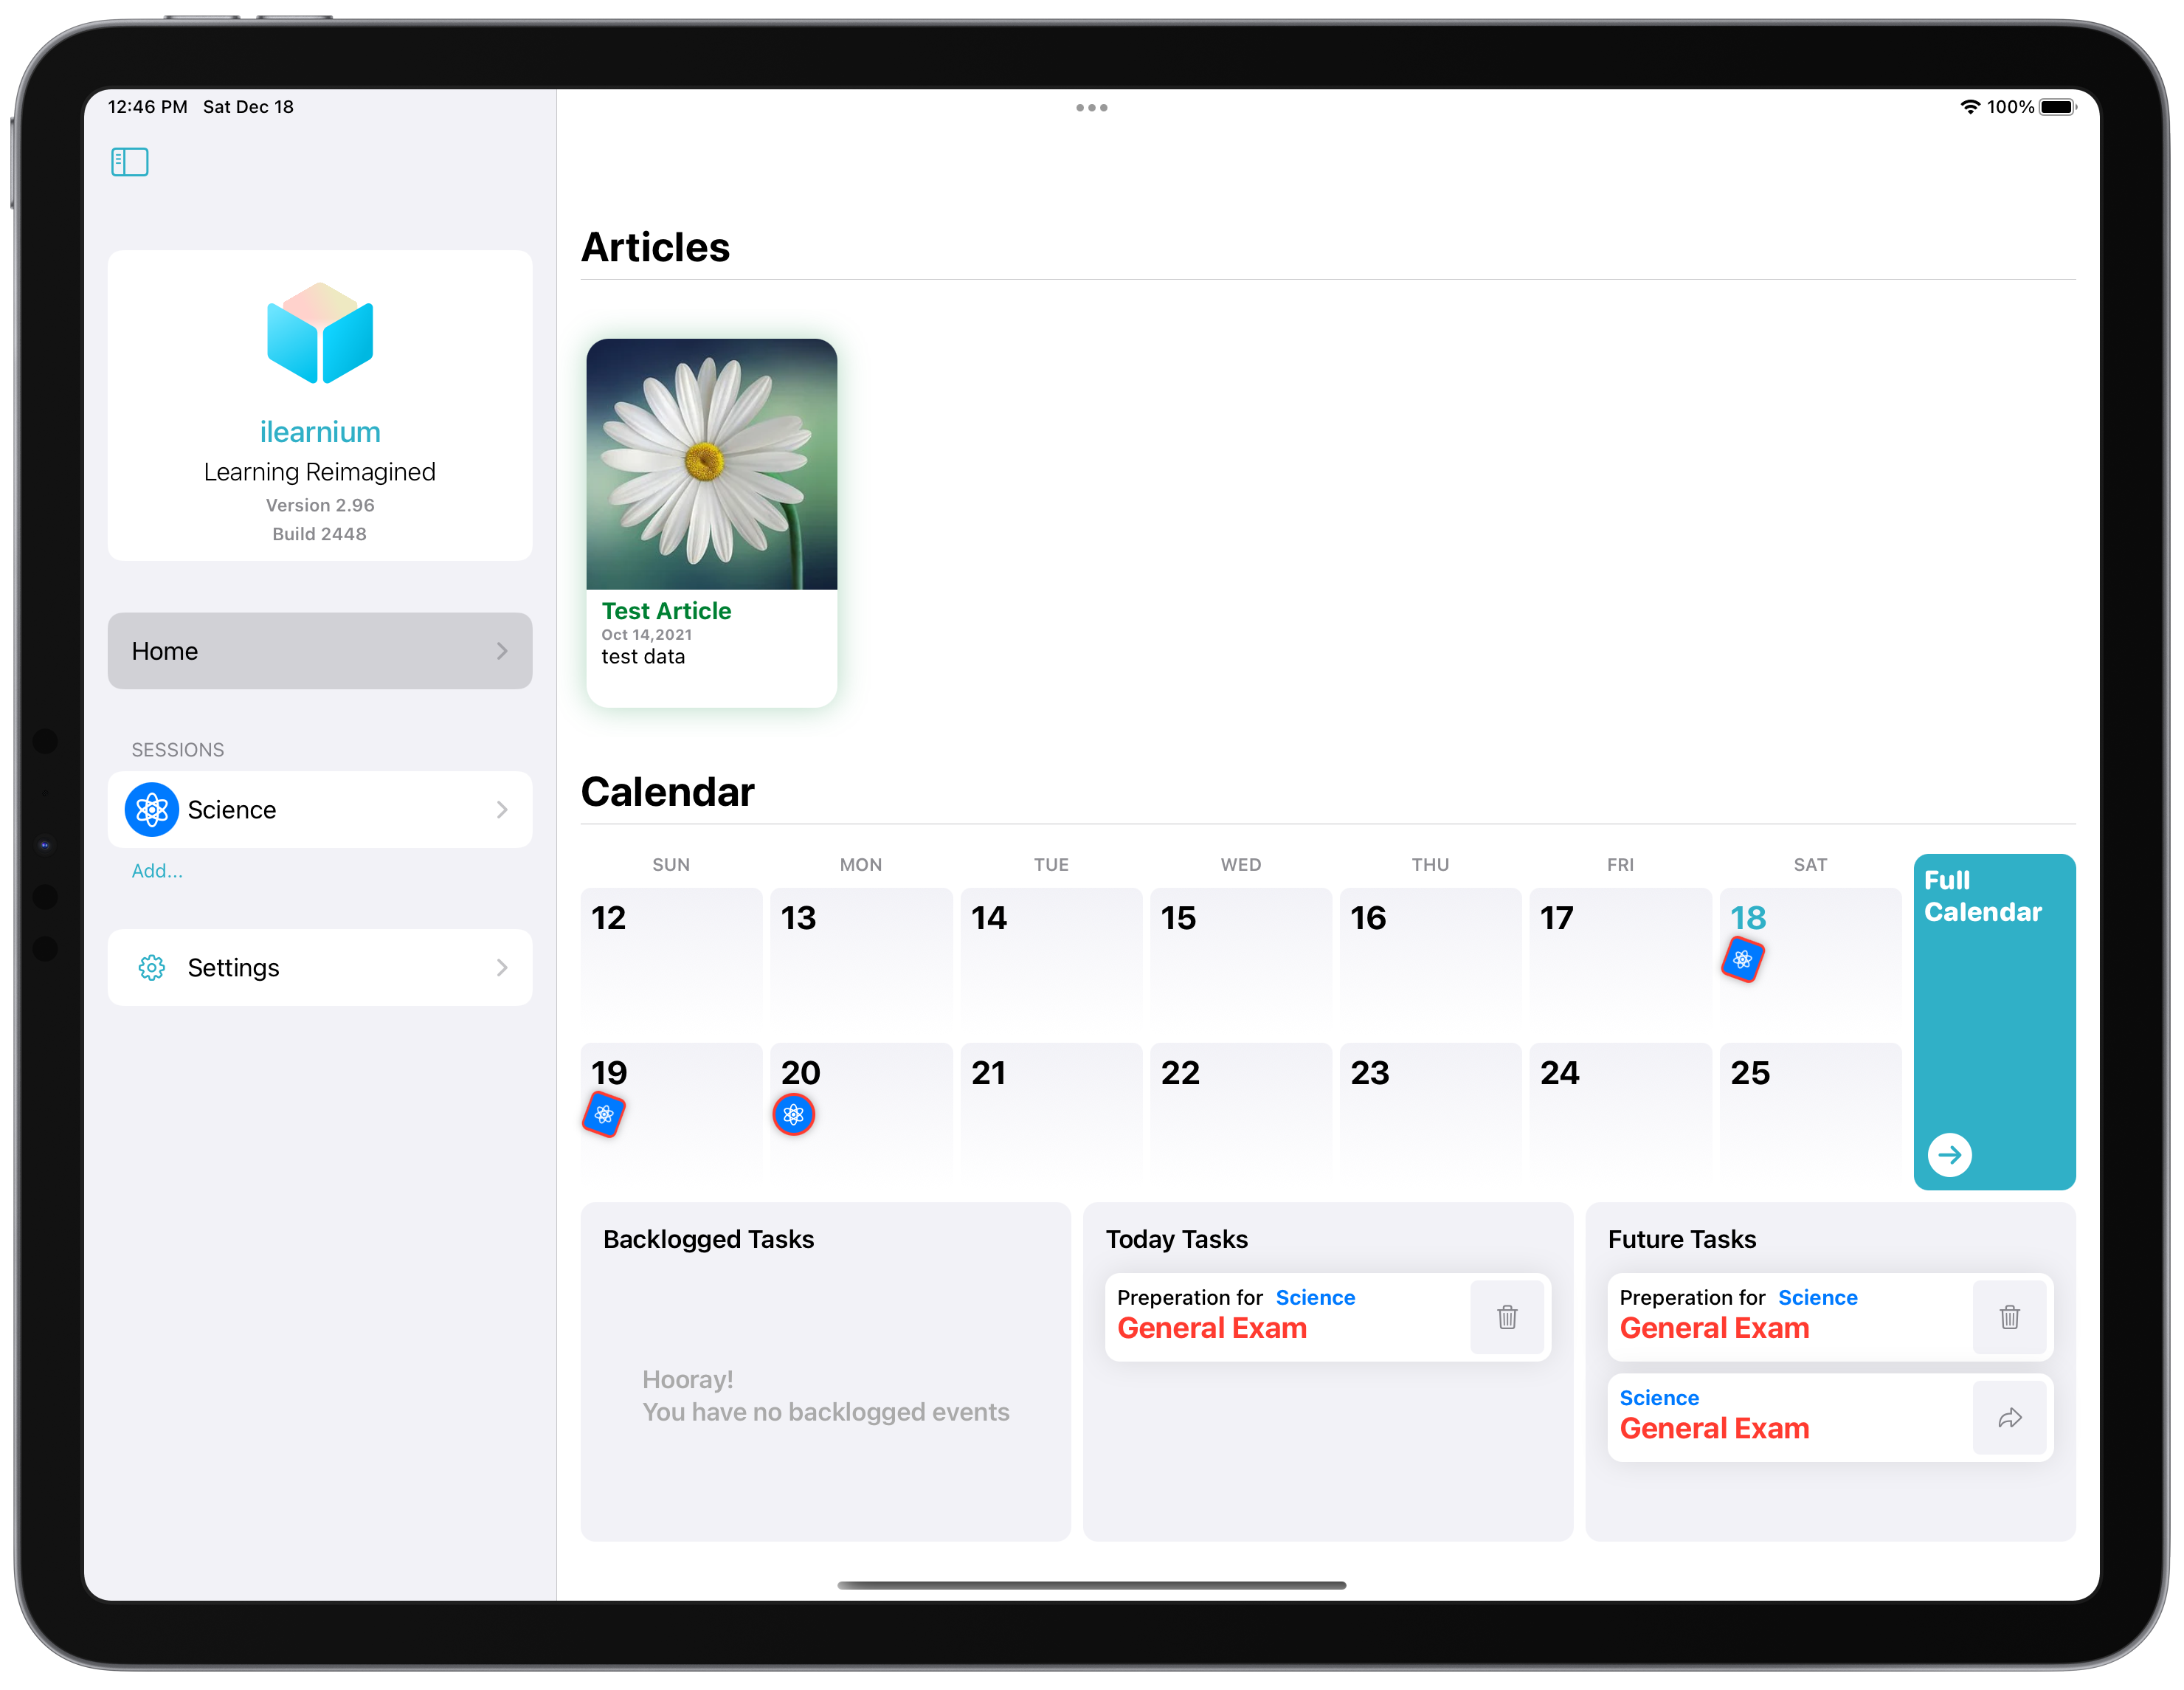
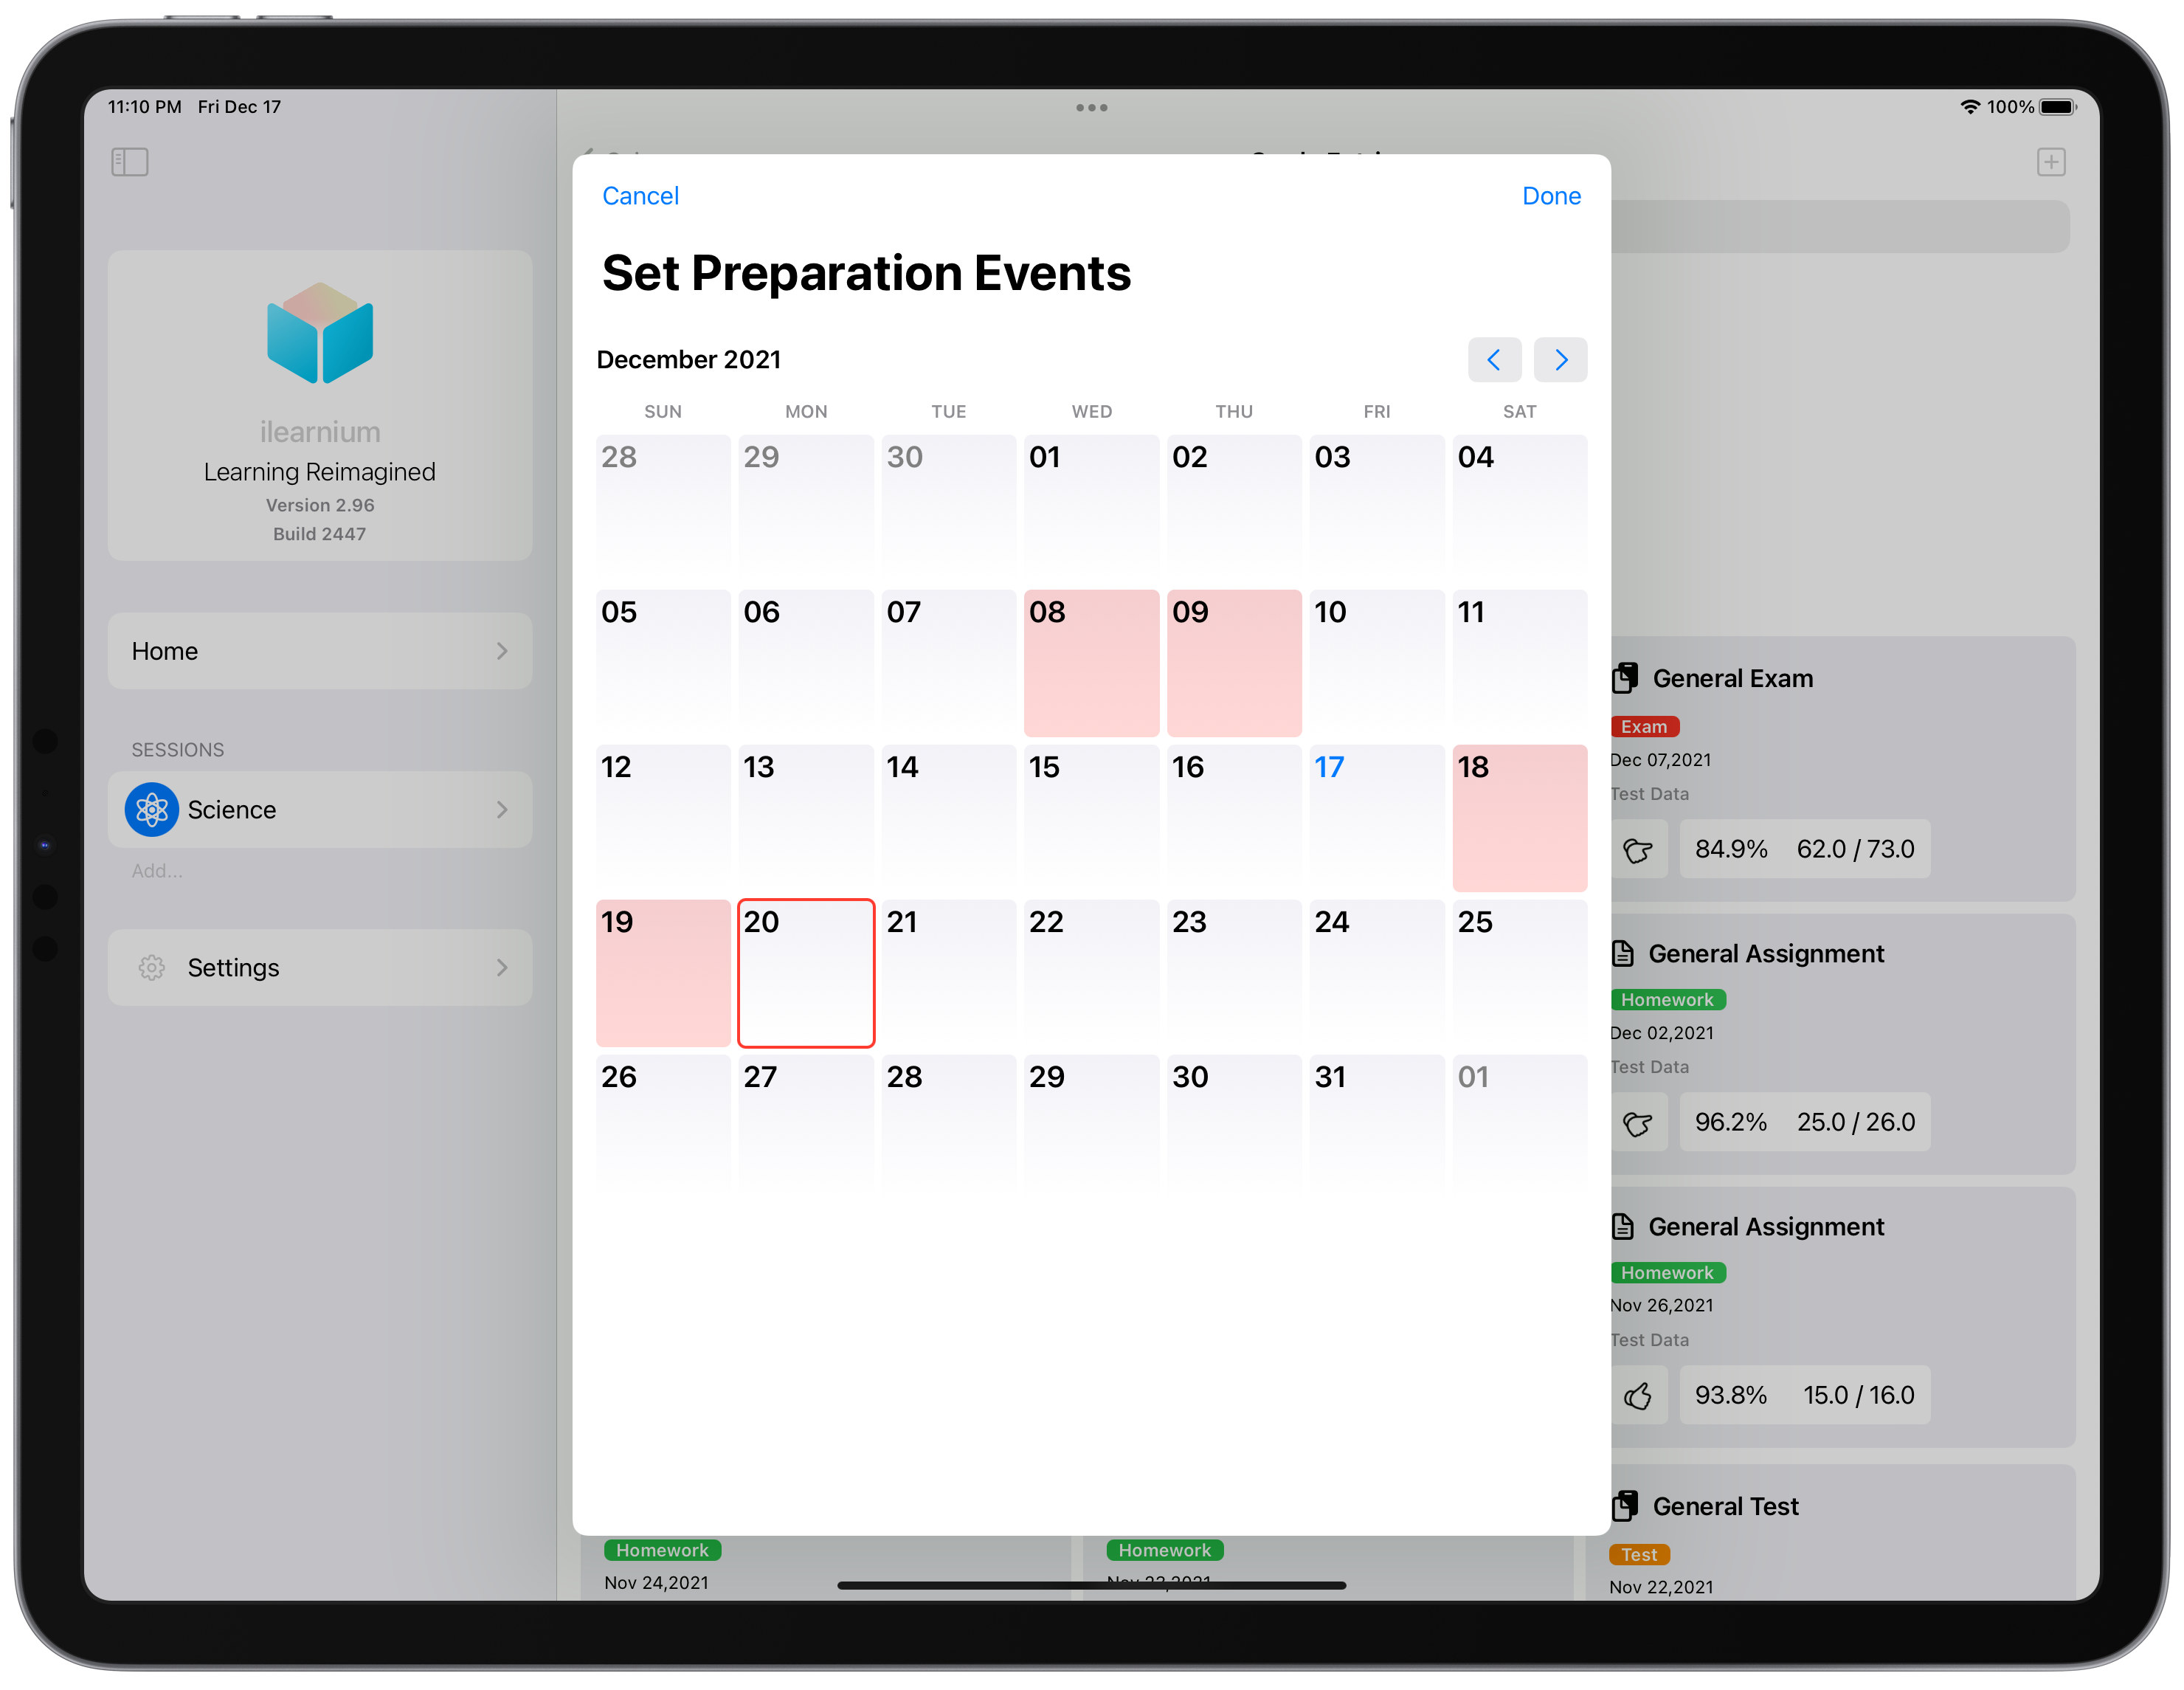
The calendar system is designed to be as readable as possible, with badges indicating events instead of lines or text. A squared badge indicates a “preparation” event, while a circular badge indicates the actual event to be prepared for. The inner color and pattern represent the user-defined “class appearance” while the outside color represents event type (red = exam, green = homework, etc.).
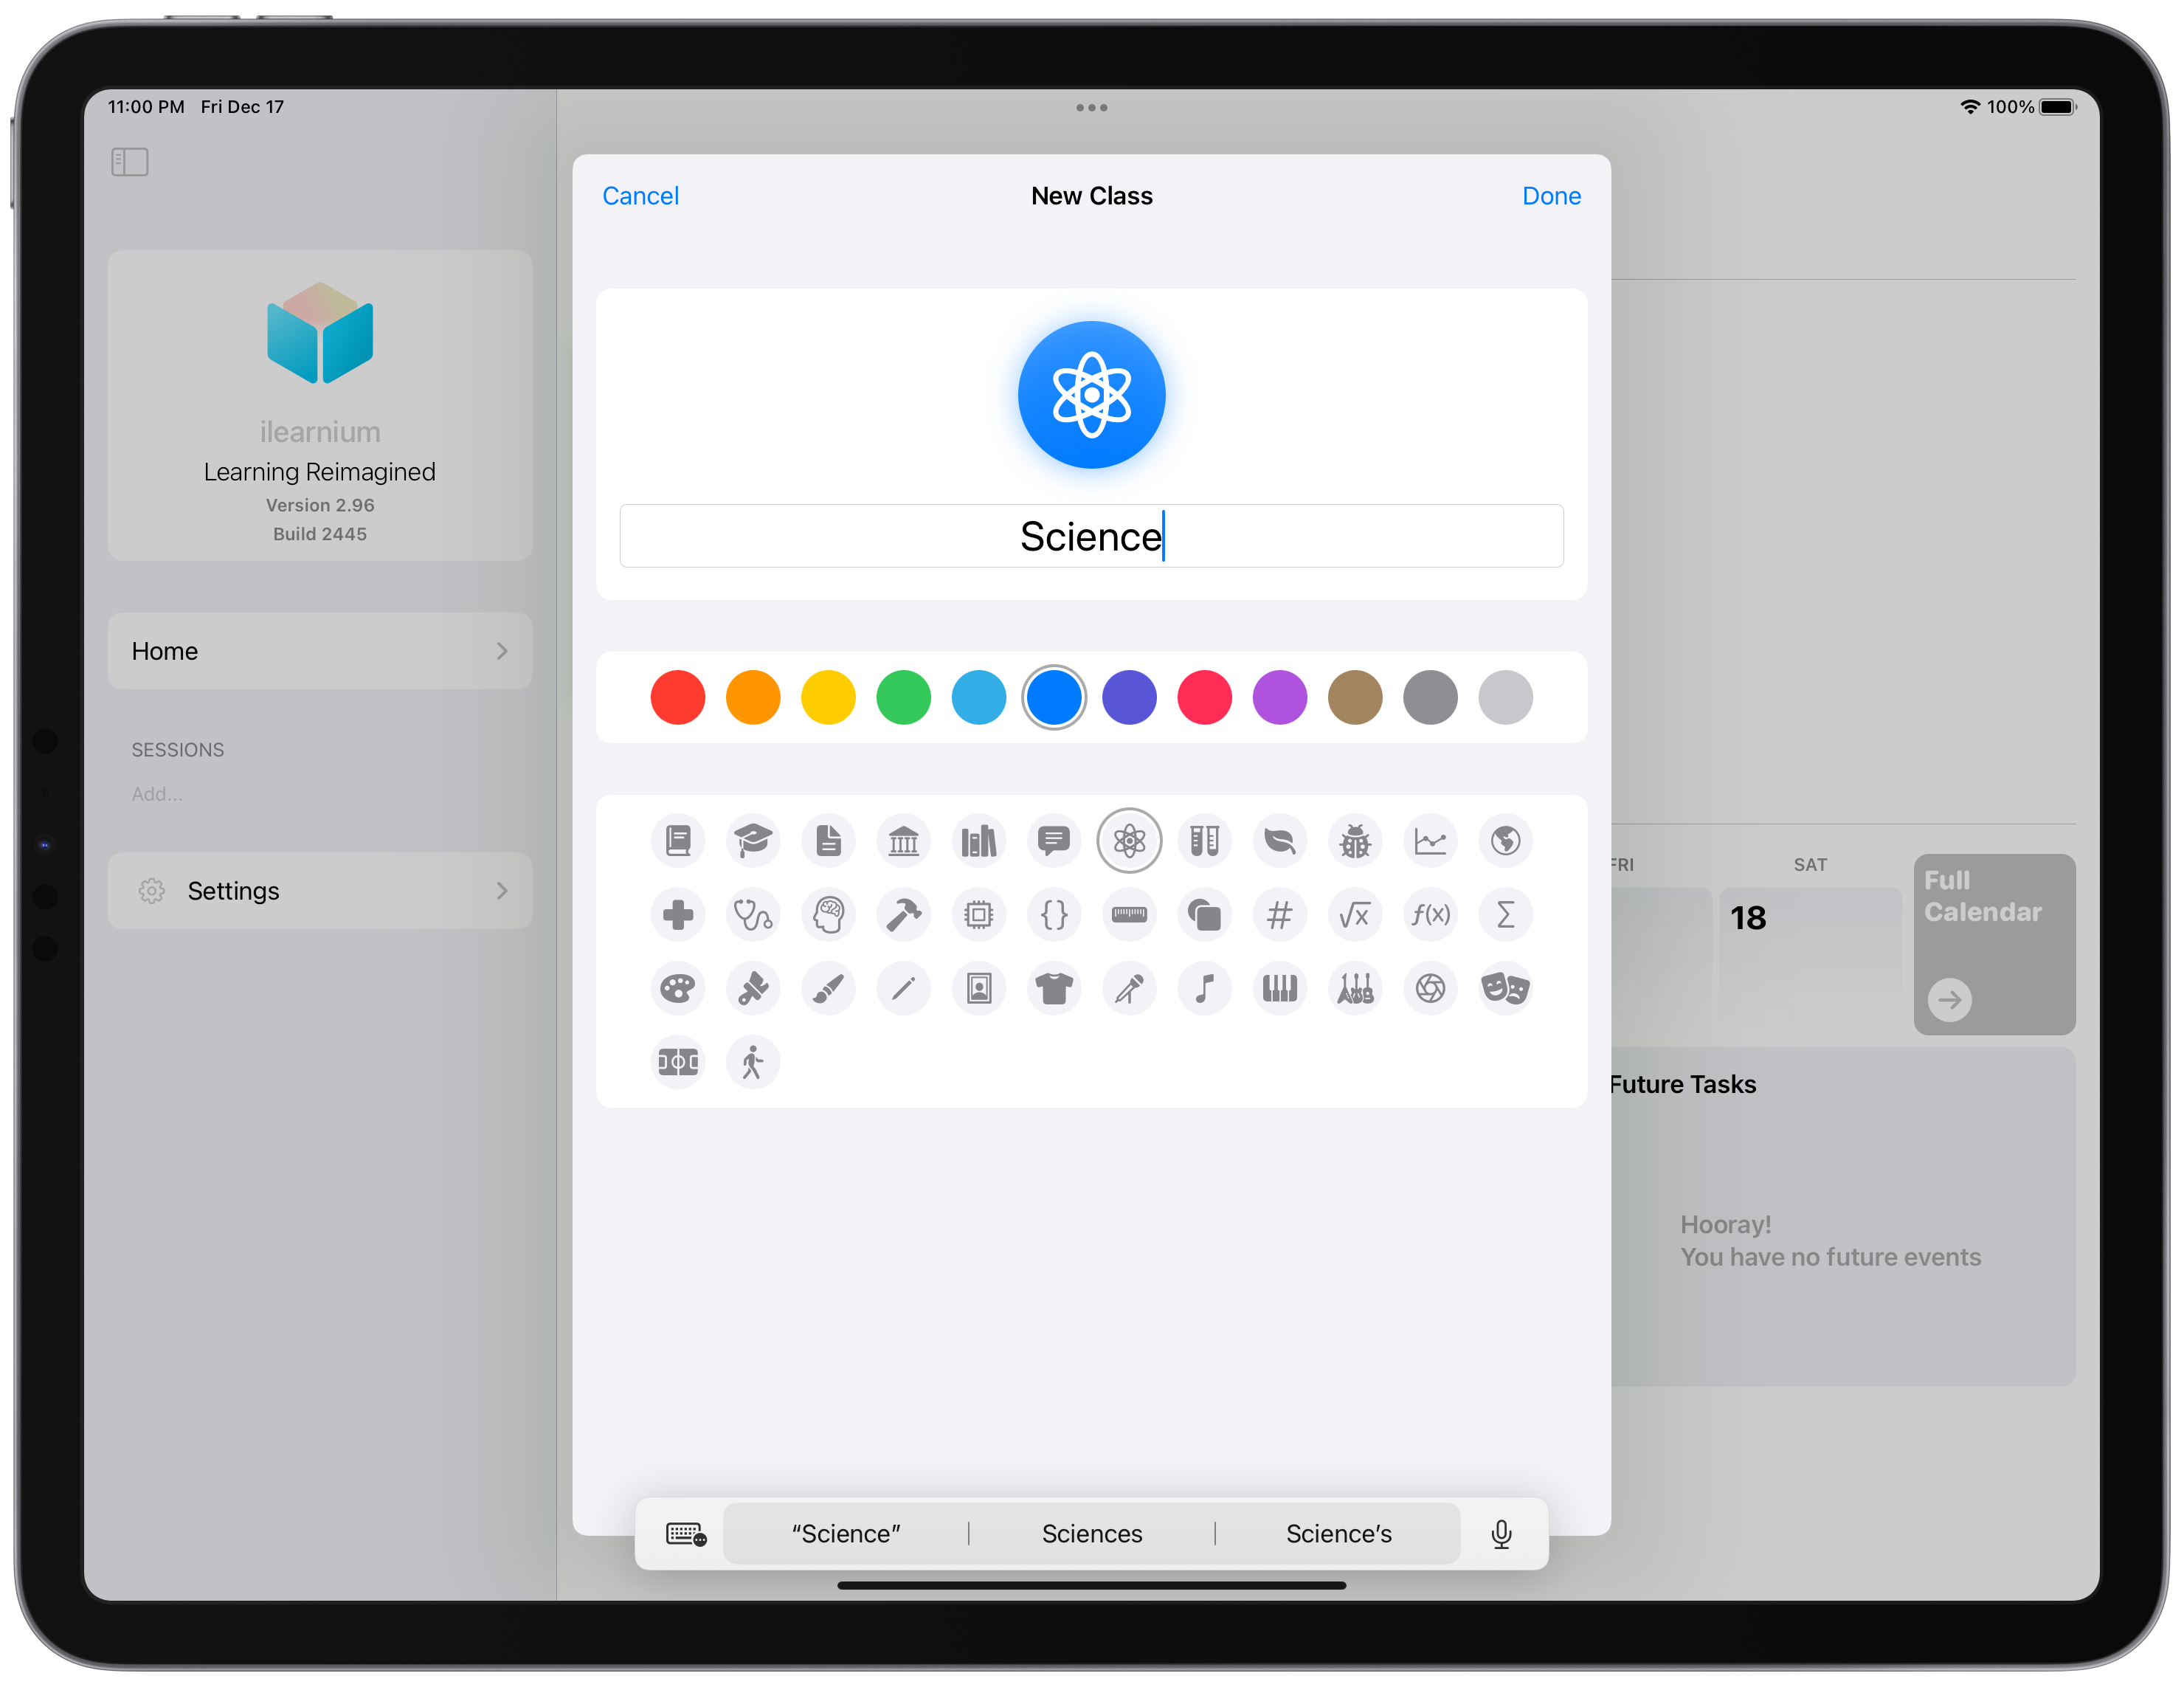
A student can then proceed to create a “class” with a theme color and badge icon.
Inside the class view, they will be presented to various completion rings (customizable by the user). There are many completion rings to choose from: grade accumulated, grade average, moving average, and goal deviation. Each of them is made for different purposes.
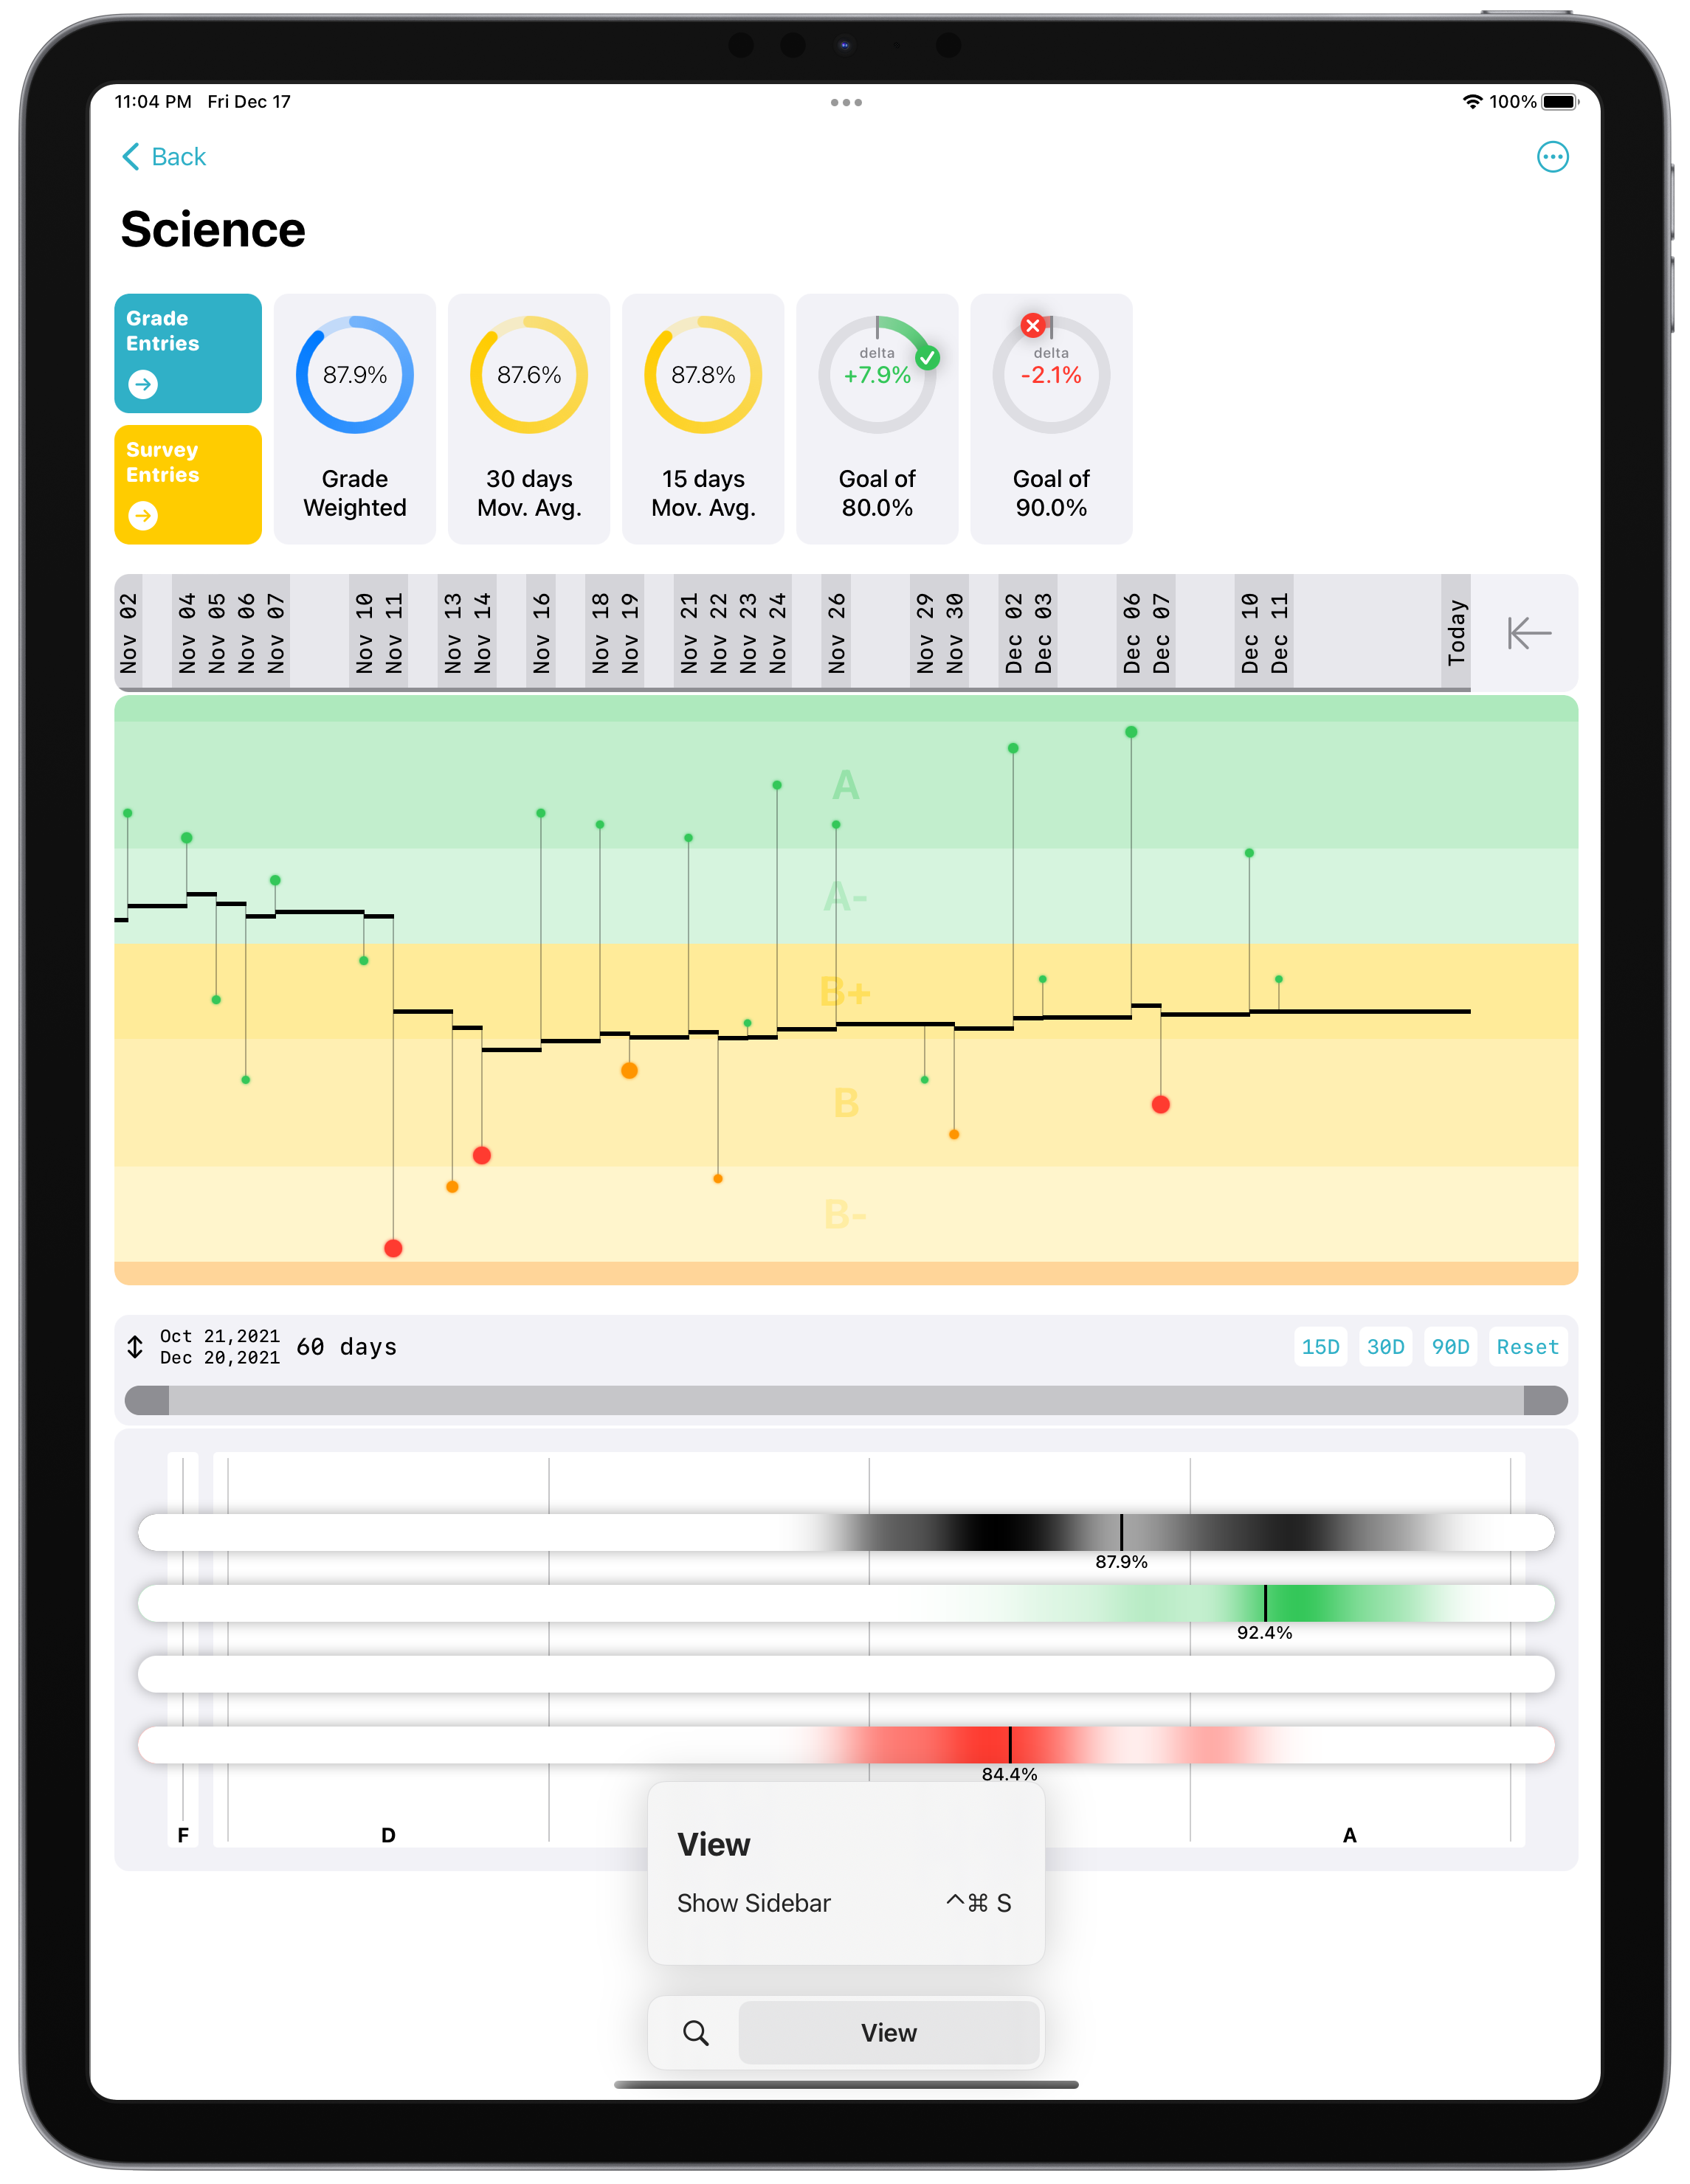
Furthermore, you are presented with a grade vs. time graph and a grade distribution graph. The grade vs. time graph shows you your grade in relation to time. You can visually see the influence of each assignment on your overall grade. You can also probe two-point to see the delta within two-time intervals. This gives a student the ability to evaluate their performance in sections of units or quarters.

The grade distribution graph shows you your grade composition in a heat-map, in three categories: assignments(CW, HW, etc.), major assignments (projects, essays, presentations, etc.), and test-quizzes. This gives the student a visual representation of the performance in various categories. There is also a range slider, that can be used to select a timeframe to calculate the heat map. Useful data can be extracted from this graph to evaluate student performance in any timeframe.
For example, subtracting the assignment grade from the test-quizzes grade gives you the student learning performance. If a student has a very high assignment grade but a very low test and quiz grade the student does not have great information retention. On the other hand, if a student has a relatively low assignment grade and an equally low test-quizzes grade, this implies the difficulty of the material and the student’s performance in class instead of poor performance in learning. But that being said, different teachers assign grades differently and these data should be interpreted in context.
From the class overview interface, you can go to the grade entry list view. The assignments are arranged to efficiently use up space, while reducing the distance between assignment name and their grade point value, dramatically increasing the readability. A search bar is also included, where you can filter by name, or #type (eg: “trigonometry #Test”).
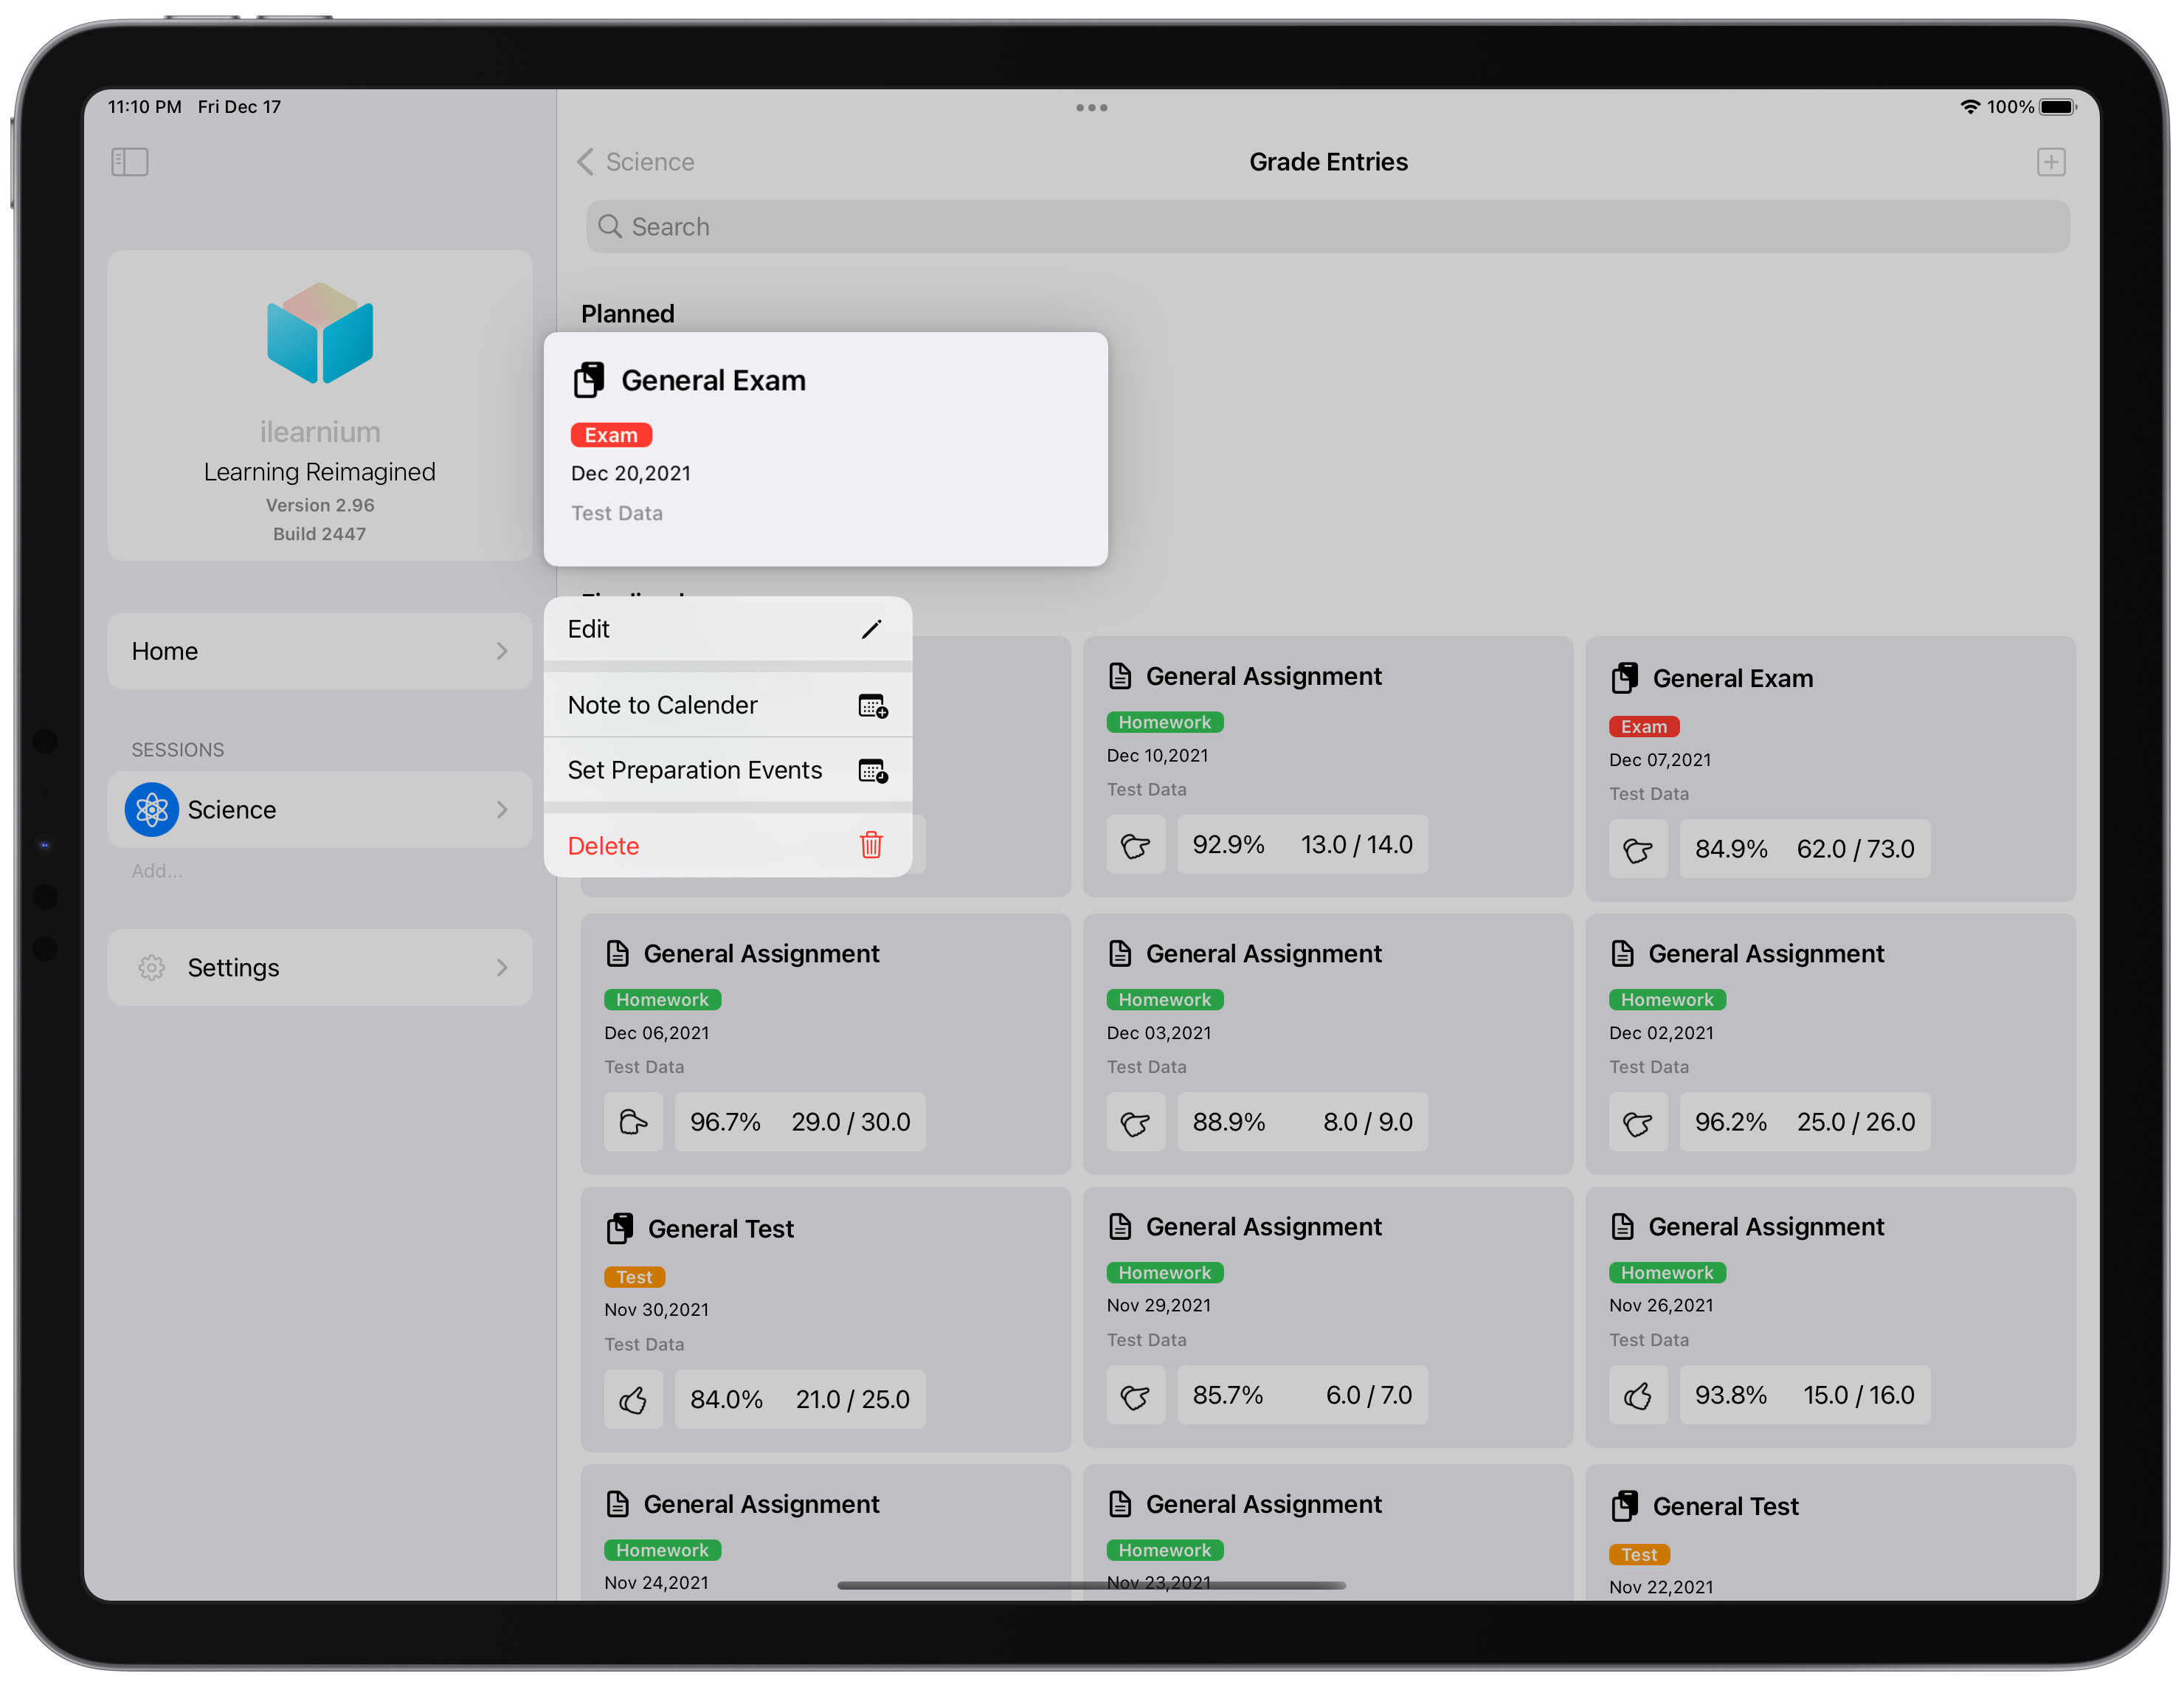
The view is arranged in two categories “planned” and “finalized”. A planned grade entry is when a student has known a grade entry that will take place but has not completed said task or received the grade yet (eg. an upcoming exam, or due date.). A planned grade entry can show up in the calendar, and preparation events can be added too. This acts as a reminder or a study planner.
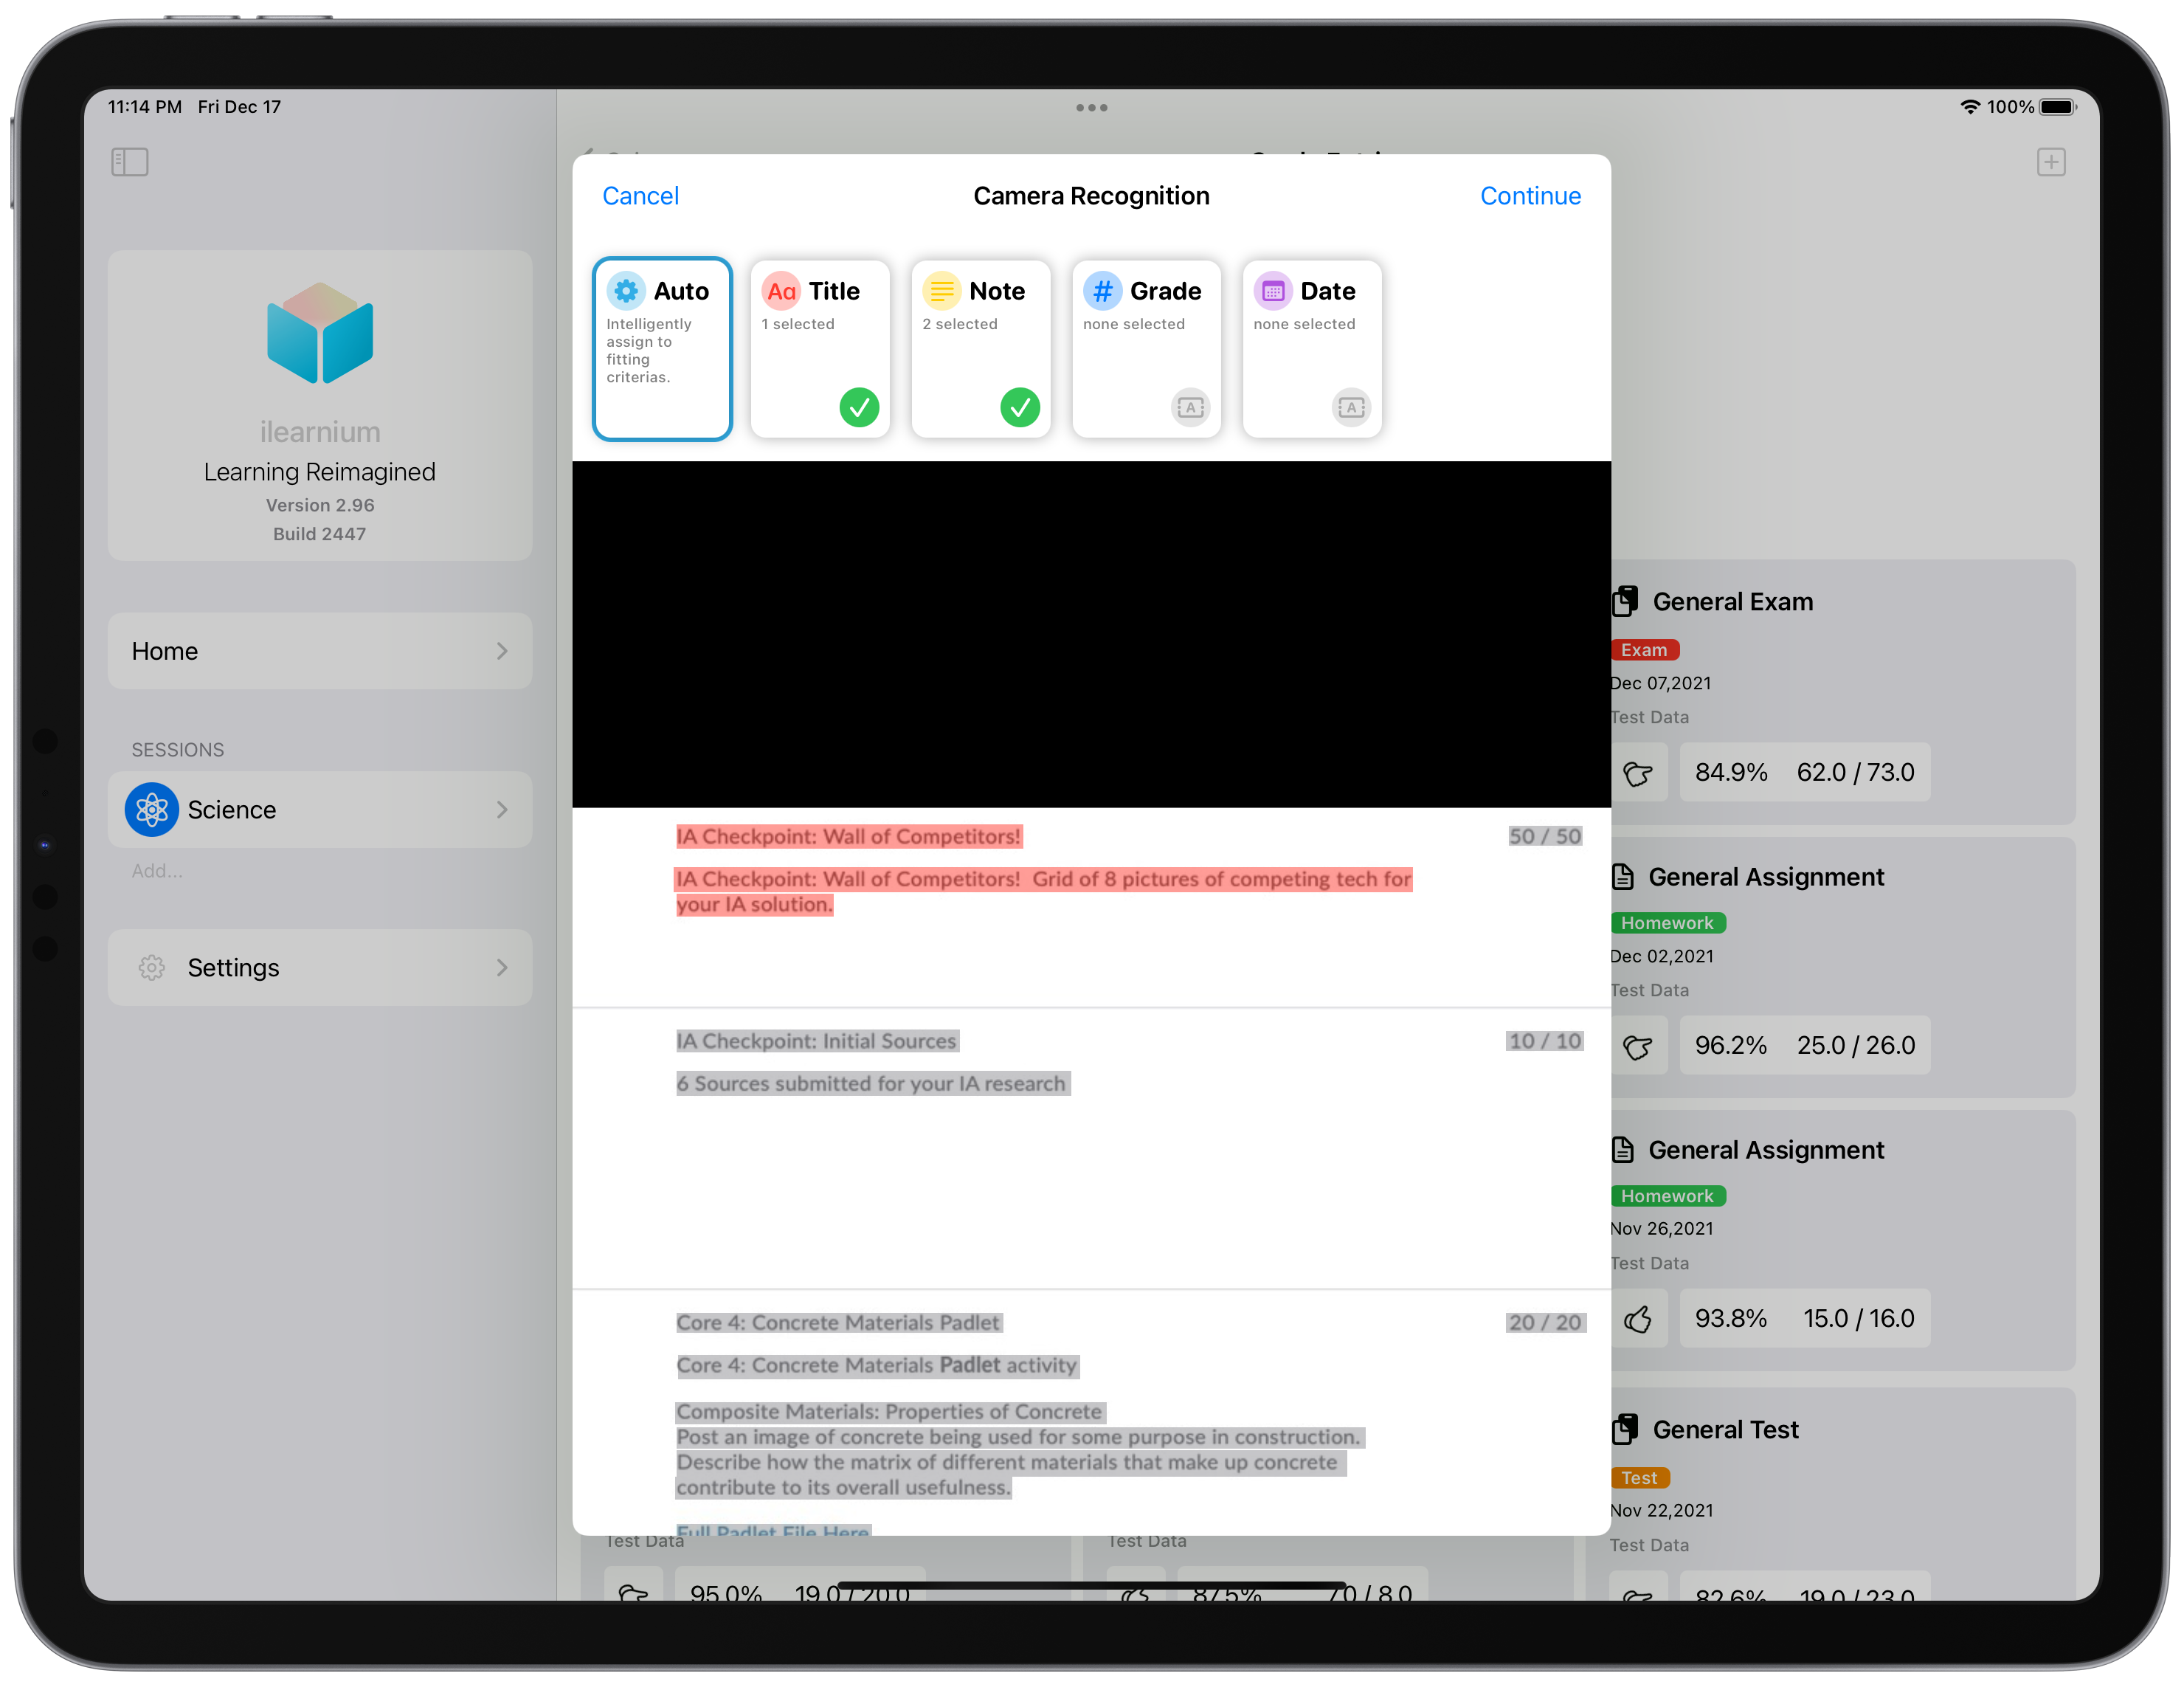
The student can add grade entries in two ways, manually or parsed from an image. The imaging method enables the student to take a screenshot of their LMS, and create a grade entry by clicking on texts. Here, a student can specify whether the event is planned or not.
When a student is importing a finalized grade entry (or converting a planned to a finalized one). They will be asked to input the grade and generate a confidence score. The confidence score can be generated from a simple slider, or a survey.
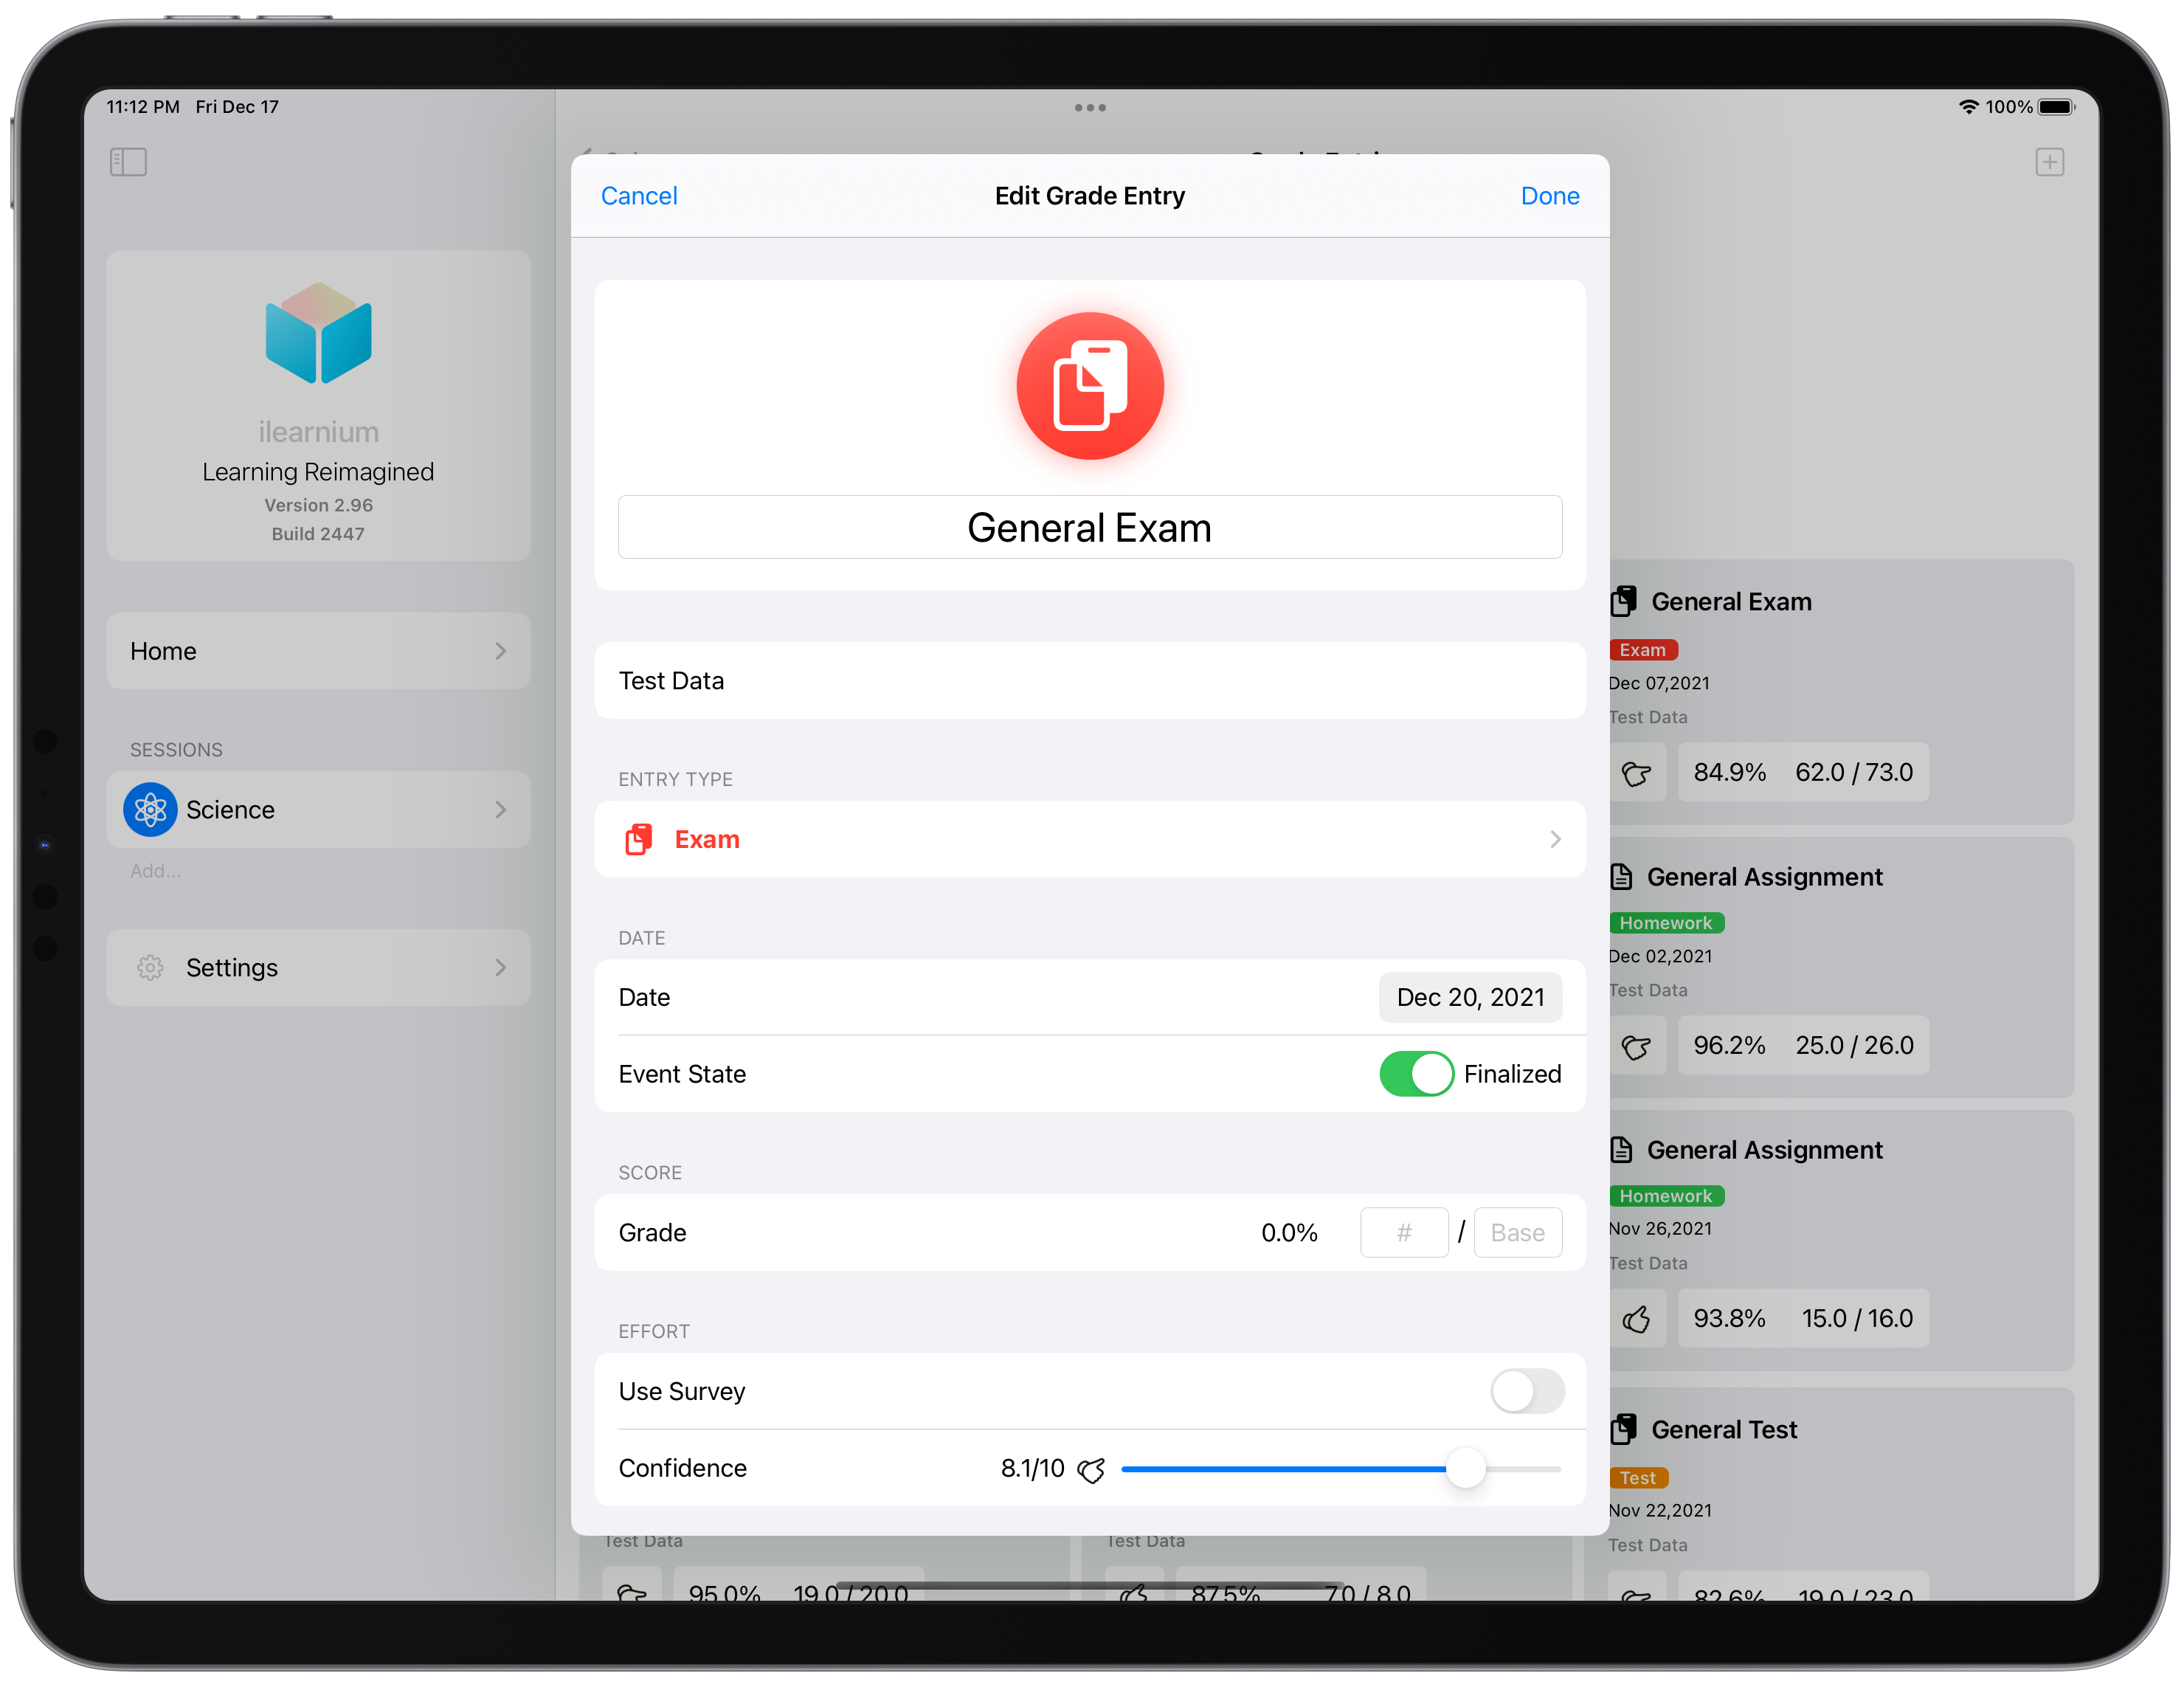
I have a more ambitious plan for this confidence score. But for now, it will serve as a place to store and document the student's immediate reaction & feeling after a grade event (eg: reaction or confidence before or after a test).
You can also access the survey list view from the class overview interface. In this view, you can see your past survey scores. Arranged in a vertically listed horizontal scrollable fashion.
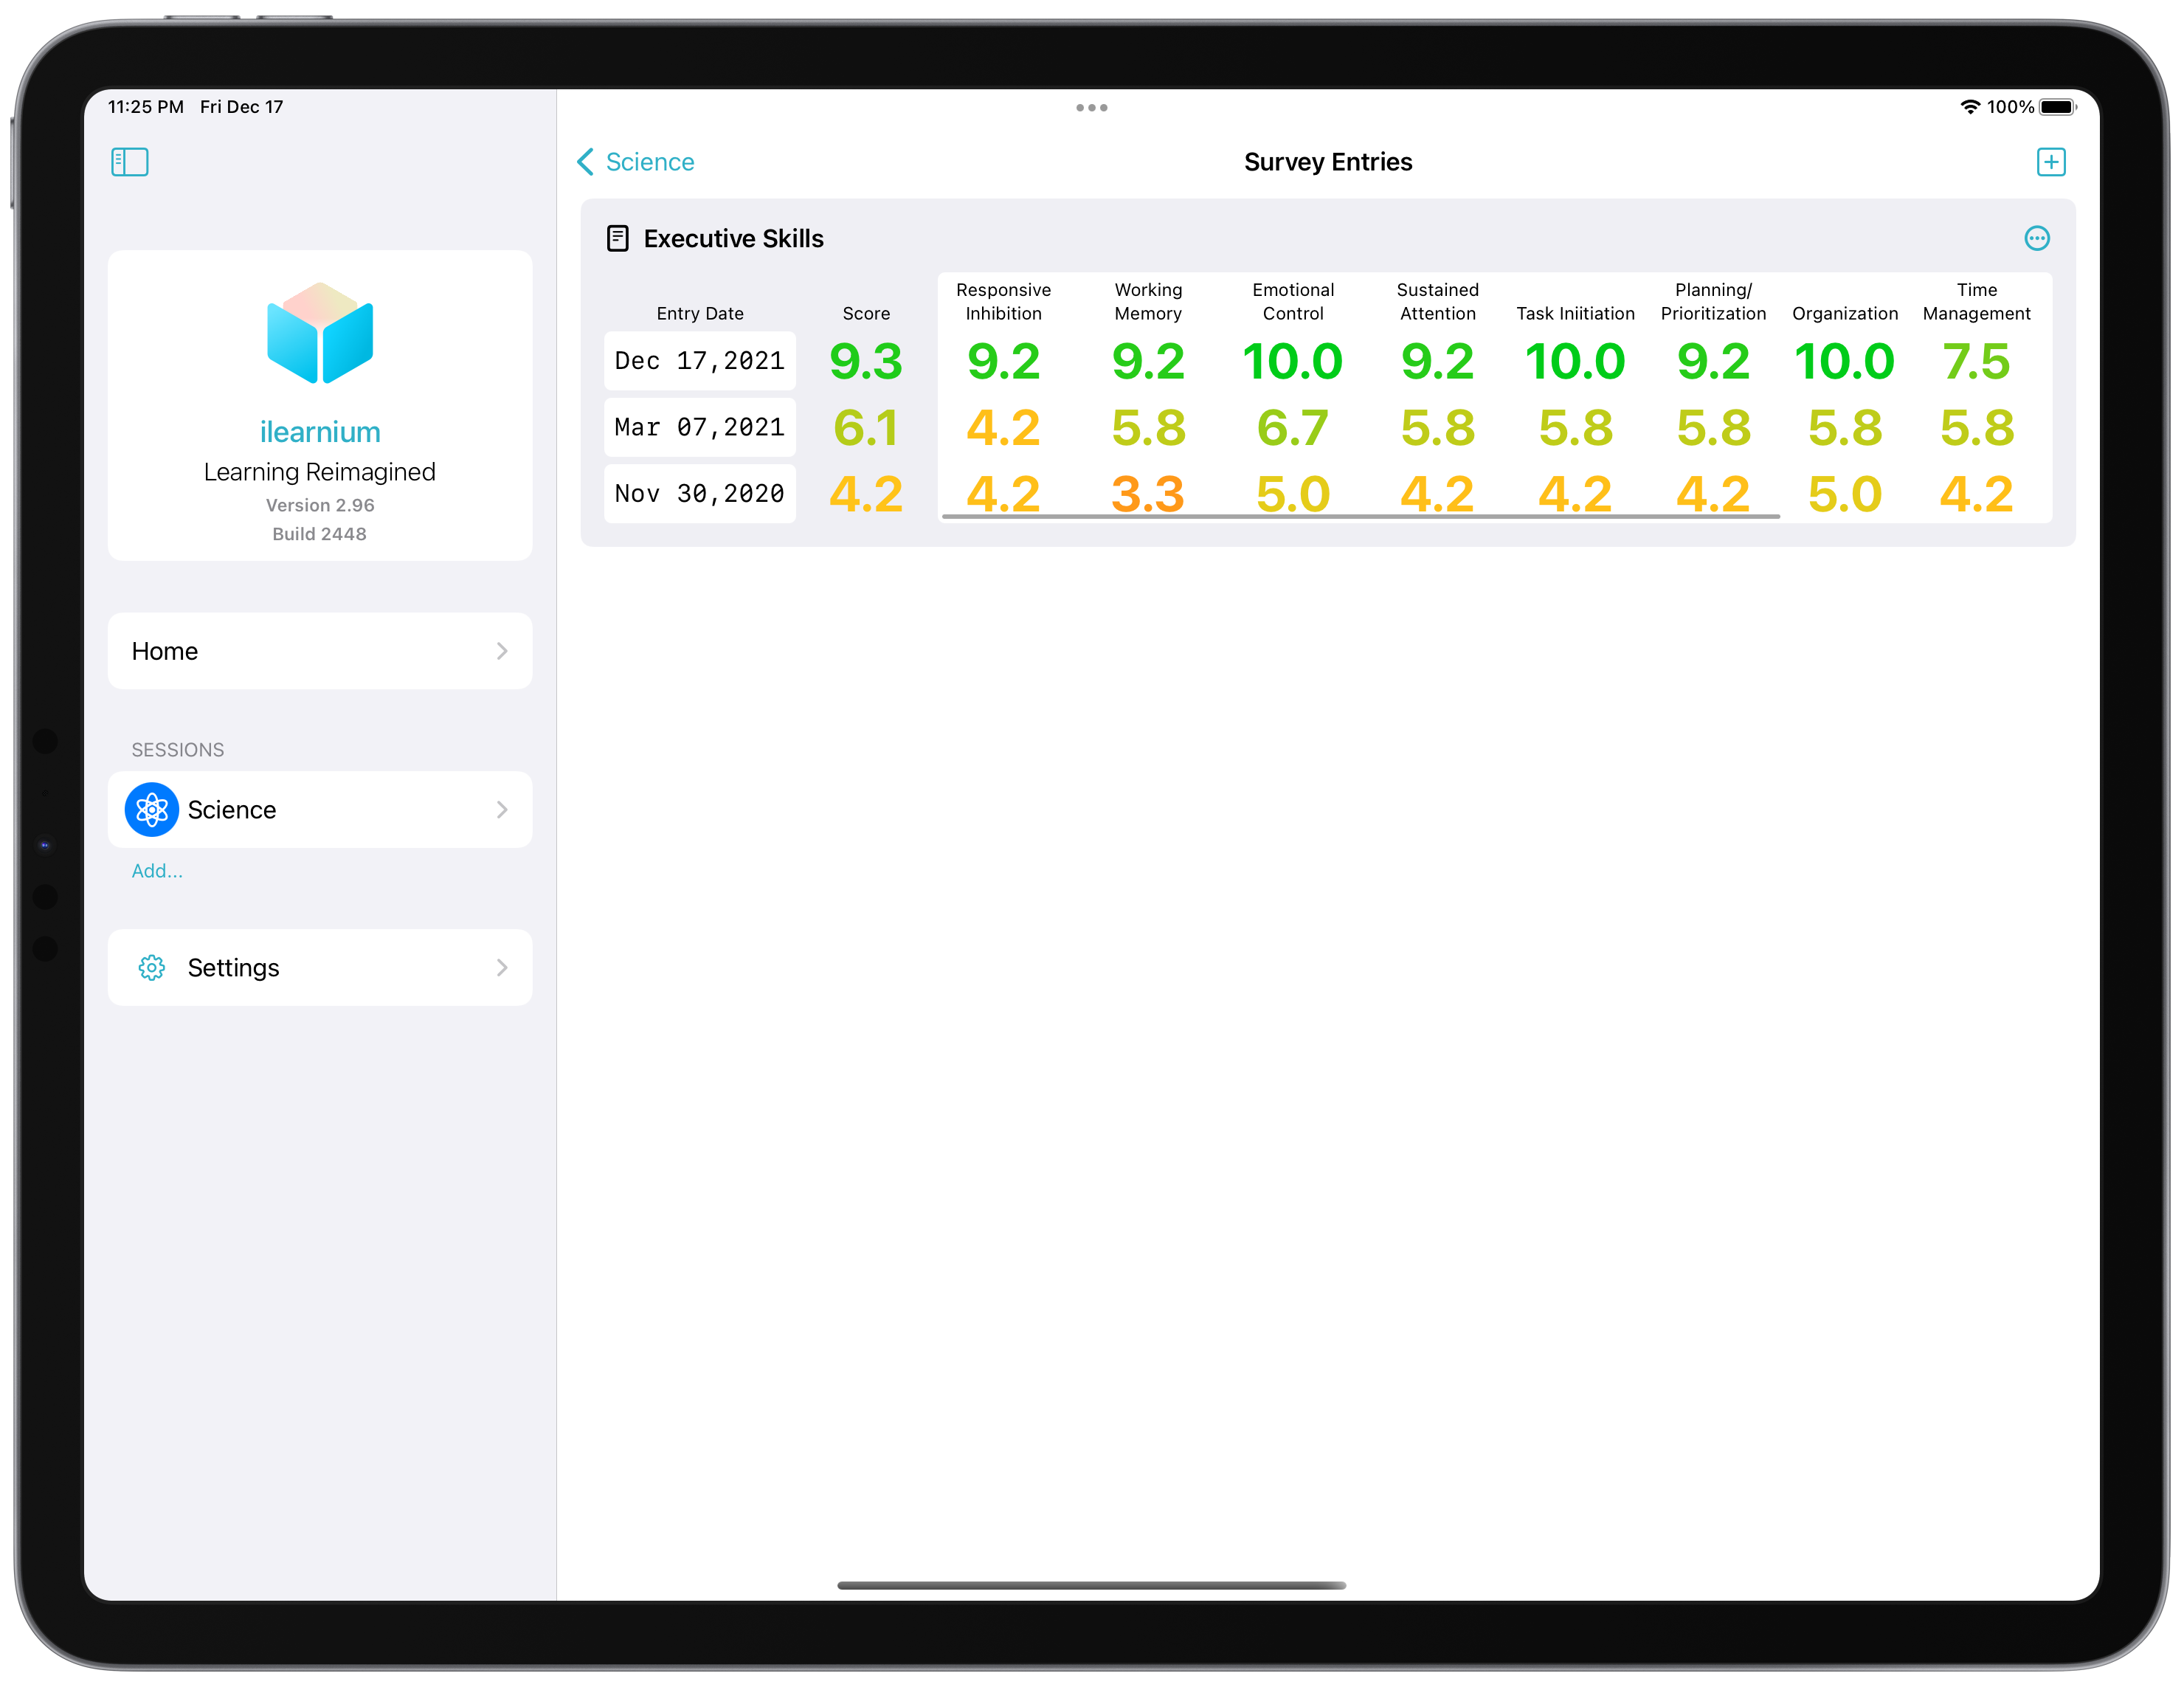
You can see that survey results are always displayed from 0.0 to 10.0 with no exception. Scores are also color-coded to indicate that a higher score is desirable than a lower one.
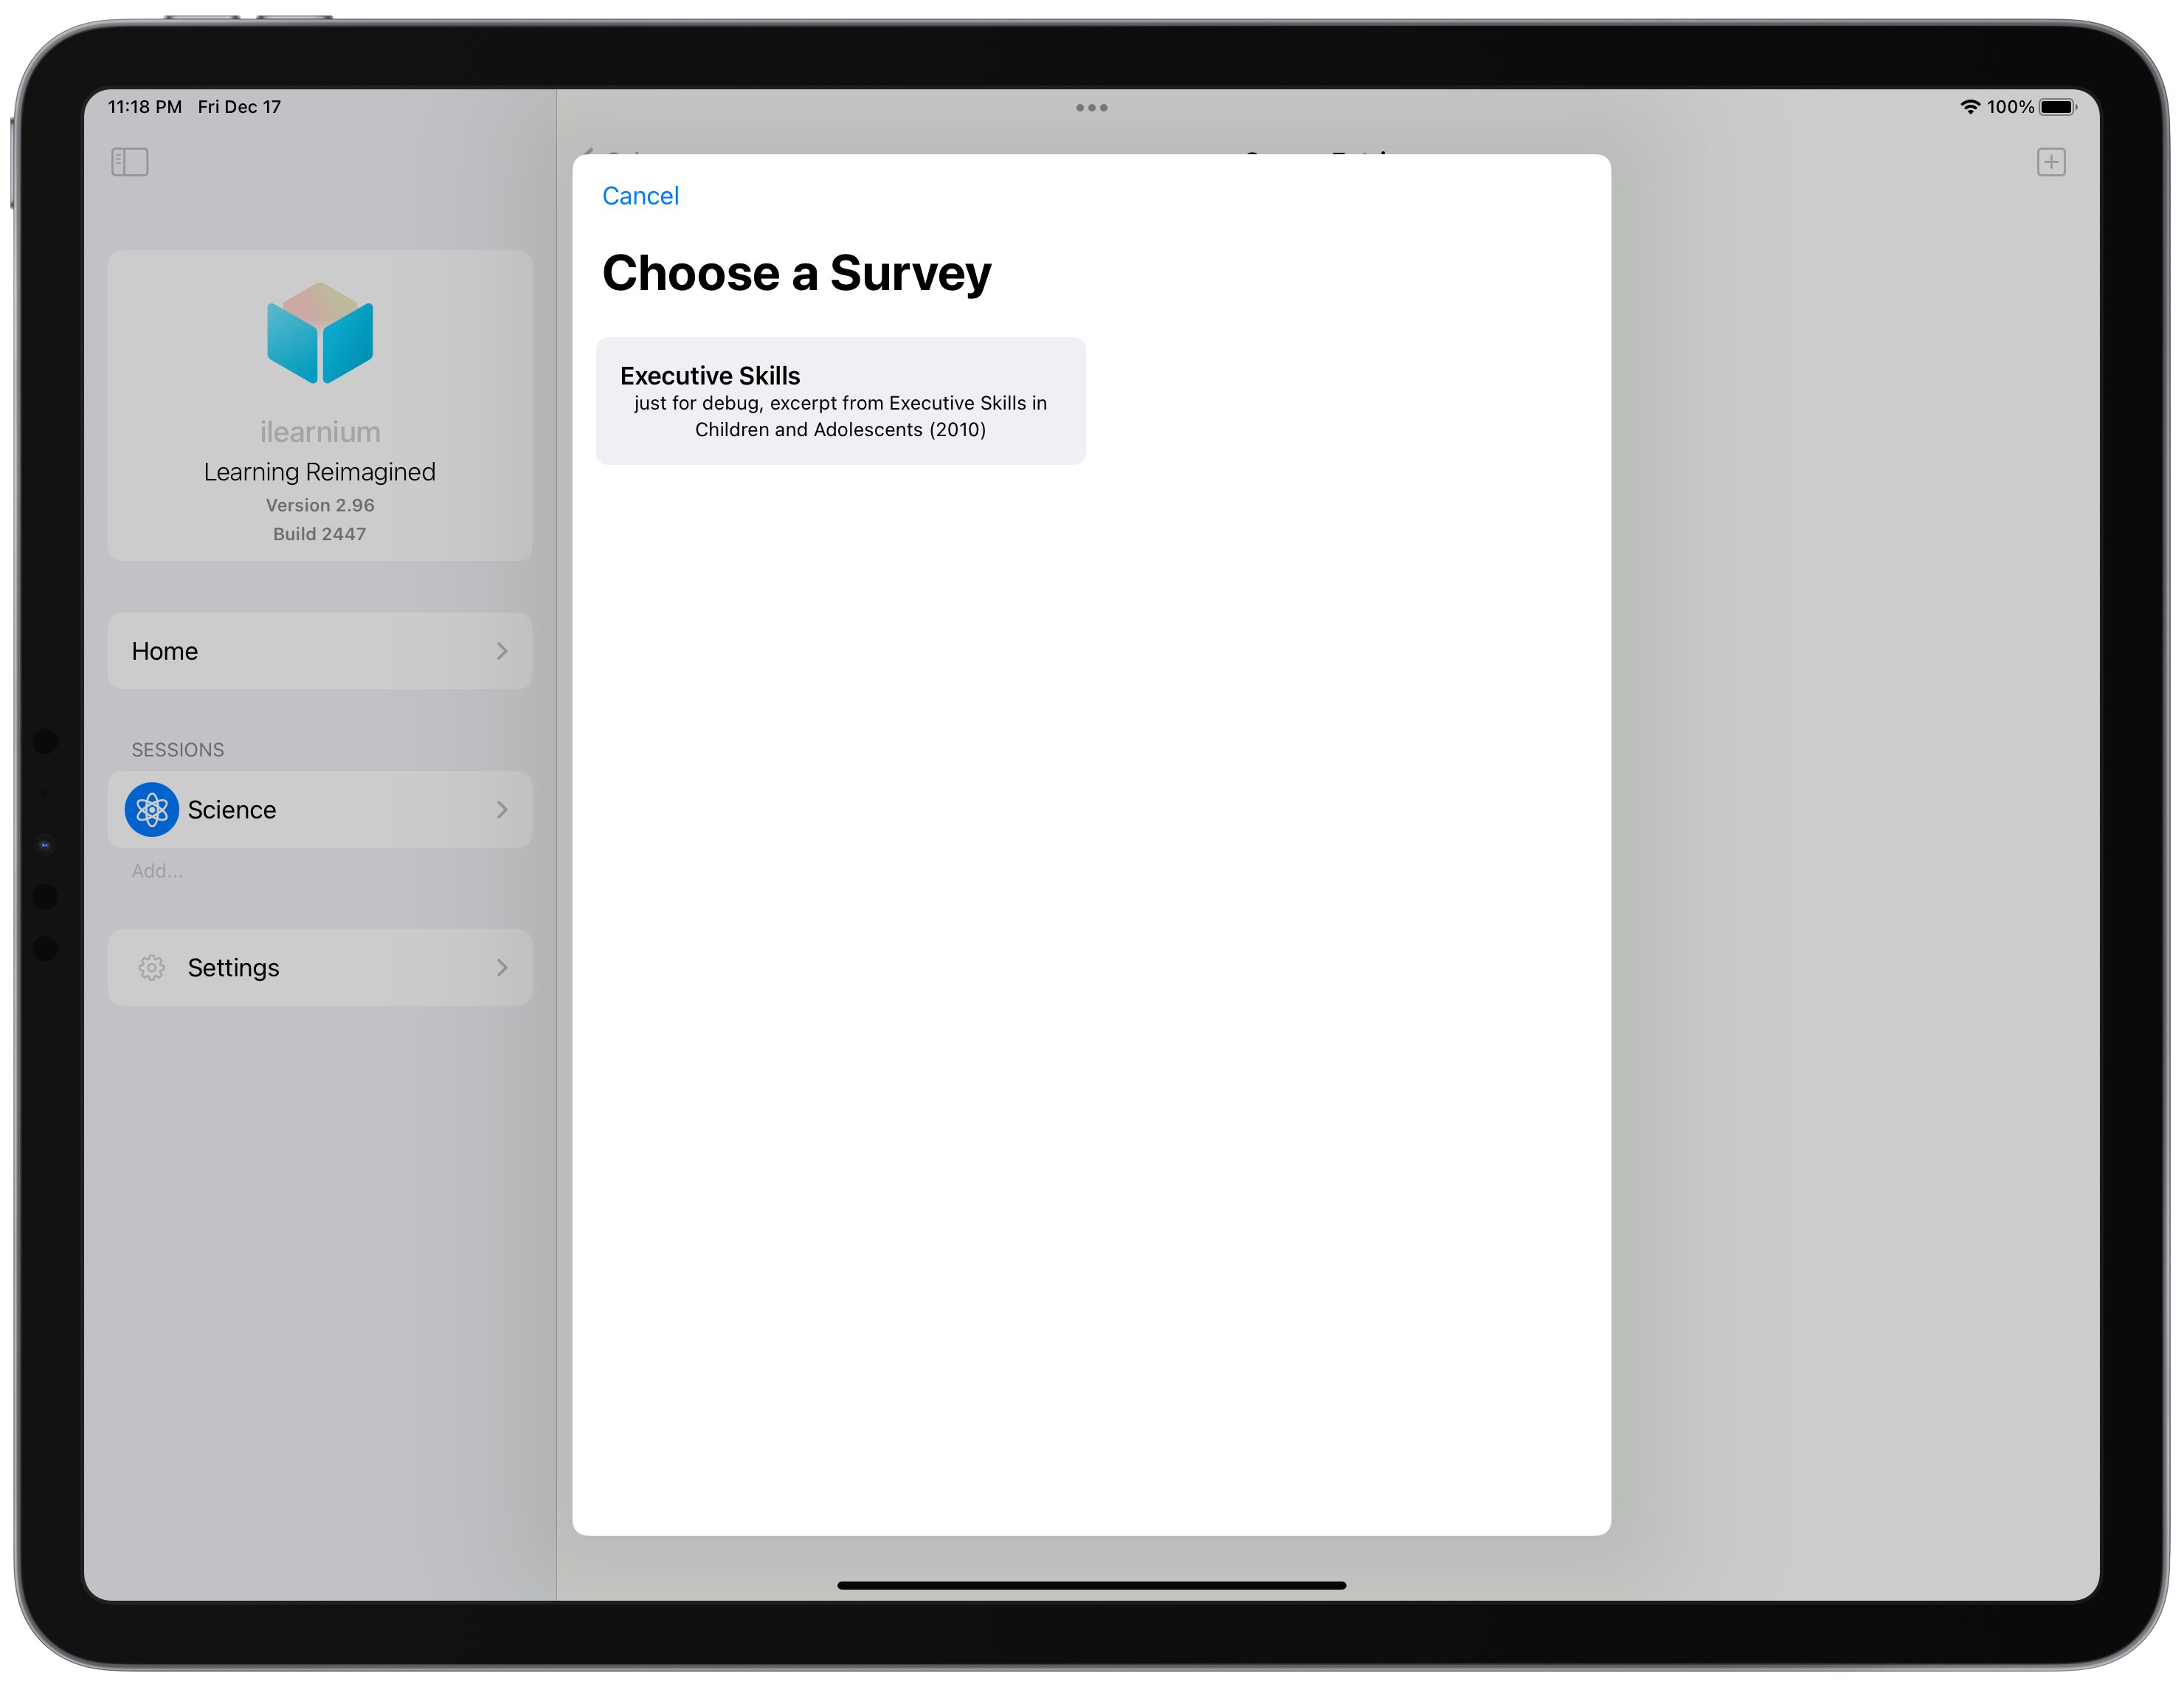
You can also take a survey in this view by using the add button. We will offer a variety of surveys that can measure a variety of different metrics. This example one listed here is “Executive Skills” excerpted from Executive Skills in Children and Adolescents (2010) (copyright to Peg Dawson and Richard Guare, use for demonstration only, will not be in the final release).

The surveys are stored on the cloud and are automatically downloaded once in use. This ensures that adding, removing, and updating surveys require no software update.
For this special purpose, I have created a survey file format based on JSON. This format allows a variety of answer formats (T/F, 1-5, etc.) and has functions that are not found on other platforms, like question branching based on mathematical formulas (allows conditional display of questions based on previous questions). The sub-scores of the survey are also defined in the JSON in mathematical formats, allowing for great potential for survey diversity. This enables anyone to create surveys that can be put into the app. You can see the format in this GitHub page.

There is other misclinious features and details that I didn't mention. They will be listed below.
Combined, I am sure that this project is going to make a great impact. It will help many students overcome challenges. I am a learner myself (a very good one actually) and cannot stress enough how important time management is. I created this program with the sole intention of convincing everyone that they can be learners, and I think I have achieved my goal quite well.
After initial Alpha testing, U.S. region iOS public beta will begin in Spring of 2022, where you can join. The app will be free and will remain free, forever. I am also considering open source options. Since I am just an ordinary high school student and cannot pay full attention to huge distractions like this one.